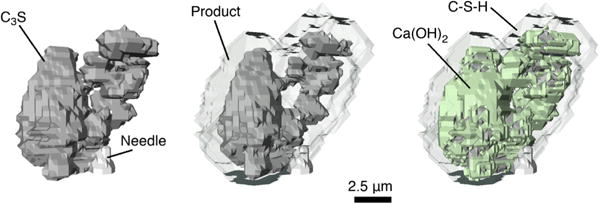
Figure 4.

Simulated microstructure of the initial system shown in Fig. 3, coarse-grained to a voxel size of 500 nm (left), and at 7 h of simulated hydration (center and right). The center image shows the entire volume of simulated hydration product as transparent gray; the image on the right shows C–S–H as transparent gray and Ca(OH)2 as light green. Each image shows the Ca3SiO5 as dark gray and the supporting needle as light gray.
