
Figure 9.
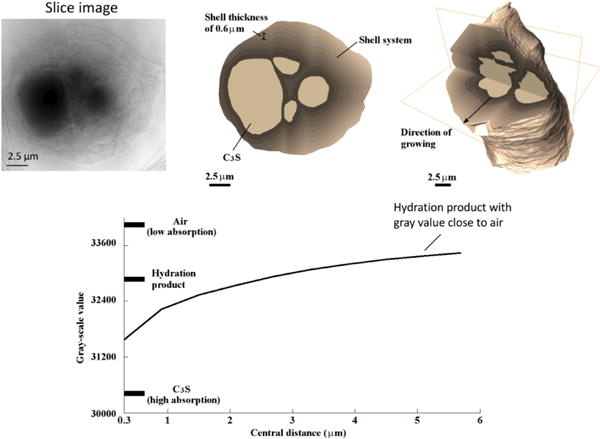
Evidence of large volumes of occluded porosity within the hydration product region can be observed in the texture of the nCT slice shown in the upper left. Calibration of gray values for Ca3SiO5 and for air outside the product region can be used to calculate relative average densities in the product region as a function of distance from the Ca3SiO5 surface, shown in the plot at the bottom, which indicates that the product becomes progressively less dense with distance and approaches values close to that of air in the outer regions of the product.