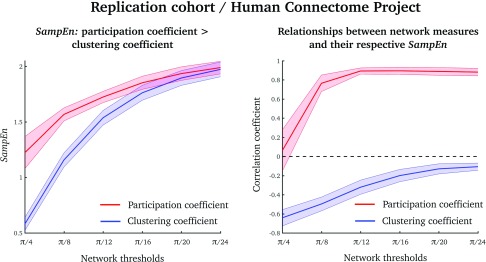
Figure 5. .
Results from a replication dataset over a range of network density thresholds (from π/4 to π/24). (Left) SampEn values of the participation coefficient (red) and clustering coefficient (blue), averaged over all nodes (akin to the results in Figure 2). (Right) Pearson’s correlation coefficients between the average clustering coefficient (blue) and participation coefficient (red) and their associated SampEns (akin to the results in Figure 3). Means and standard deviations are displayed as lines and shaded colors, respectively.

