. 2018 May 1;7:e35731. doi: 10.7554/eLife.35731

Figure 5. Effect of TF dimerization on binding kinetics.

(A) Association of unfolded PhoA with TF monitored by tryptophan fluorescence. (B) Fitting of the data for the association of PhoA with TF by a single exponential function (gray line) or the sum of two exponential functions (black line), indicating that two exponential functions are required to fit the data. (C) Plots of the observed rate constant (kobs) as a function of the concentration of the dimer (left) and the monomer (right) of TF. (D) Association of PhoA with TFmon monitored by tryptophan fluorescence. (E) Plot of the observed rate constant (kobs) as a function of the concentration of monomeric TF.

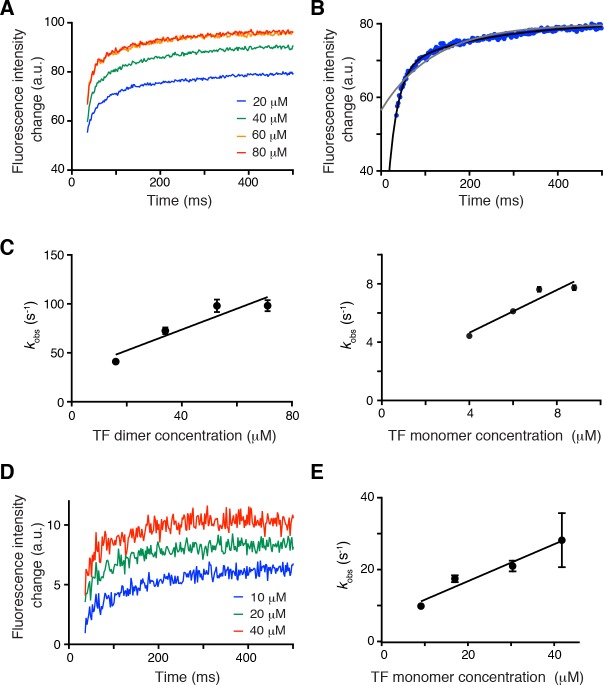
Figure 5.

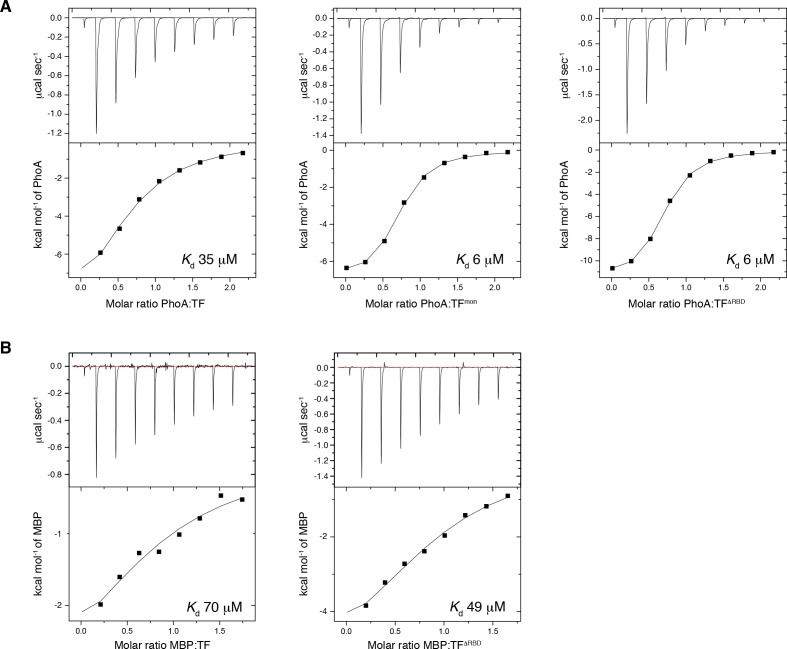
Figure 5—figure supplement 1. ITC traces of the titration of unfolded proteins to TF.

Figure 5—figure supplement 1.

ITC traces of the titration of PhoA220-310 (A) into TF (left panel), TFmon (middle panel), and TFΔRBD (right panel), or MBP198-265 (B) into TF (left panel) and TFΔRBD (right panel), Monomeric variants of TF indicated stronger affinity to the unfolded substrates, which is consistent with the fact that the three of the substrate-binding sites are buried in the dimer. The titration of PhoA220-310 and MBP198-265 were performed at 8°C and 22°C, respectively.
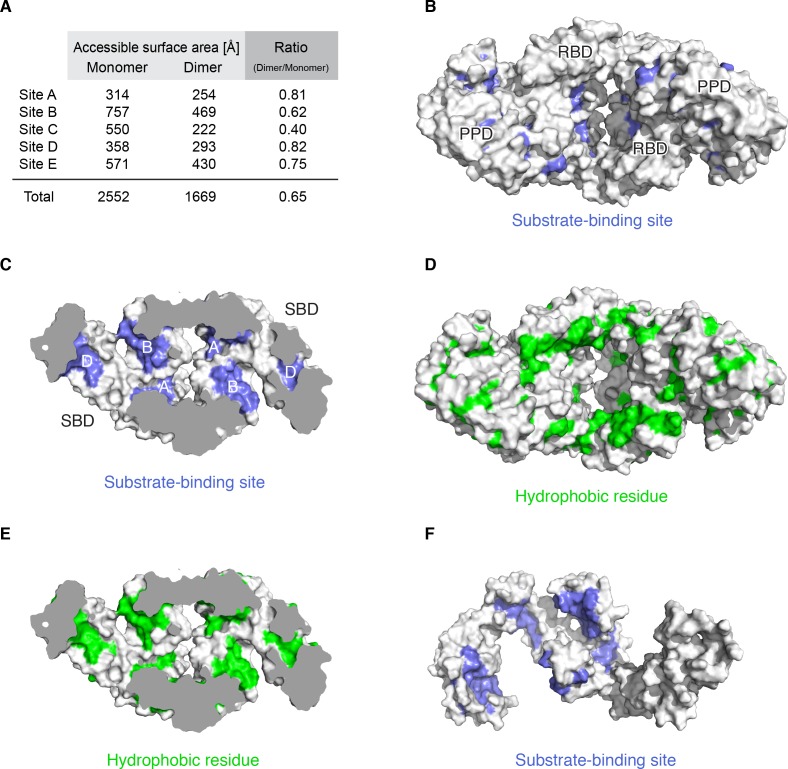
Figure 5—figure supplement 2. Substrate-binding sites in the dimer.

Figure 5—figure supplement 2.

(A) Accessible surface area of the substrate-binding sites in monomeric and dimeric TF. (B) The residues identified by NMR to interact with unfolded MBP are colored blue on the surface of TF dimer. (C) Cut-away view of the TF dimer with the mapping of substrate-binding sites as in the panel B. Substrate-binding sites A, B and D are assembled on the inner surface of the cavity in the dimer, forming a single broad substrate-binding site. (D) Mapping of hydrophobic residues colored green on the surface of TF dimer. The pore of the dimer is paved with a large hydrophobic surface on RBD that leads into the cavity. (E) Cut-away view of the TF dimer with the mapping of hydrophobic residues as in the panel D. (F) The mapping of the substrate-binding sites colored blue on the surface of the crystal structure of monomeric TF [PDB code: 1W26].