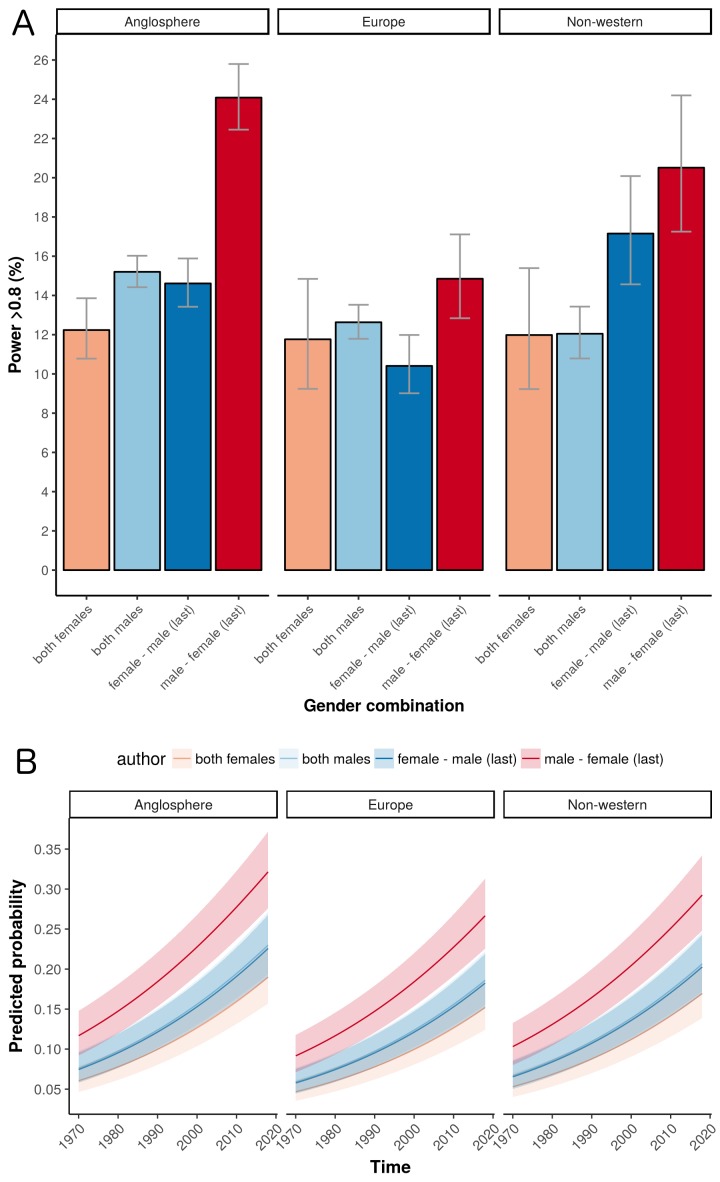
Figure 4. The influence of geography on the percentage of trials that are adequately powered.
(A) Percentage of trials with power > 0.8 for the four gender combinations of first and last author within the three country groups. Error bars represent the 95% confidence interval for proportions. (B) A logistic regression multivariable model (see "Data analysis and statistical model" below) can be used to predict the probability that a trial will have a power above a certain value. Here the predicted probabilities that trials will have power > 0.8 are plotted as a function of year for the four gender combinations in the three country groups. The predicted probabilities are averaged across medical disciplines and plotted as mean and 95% confidence intervals.

