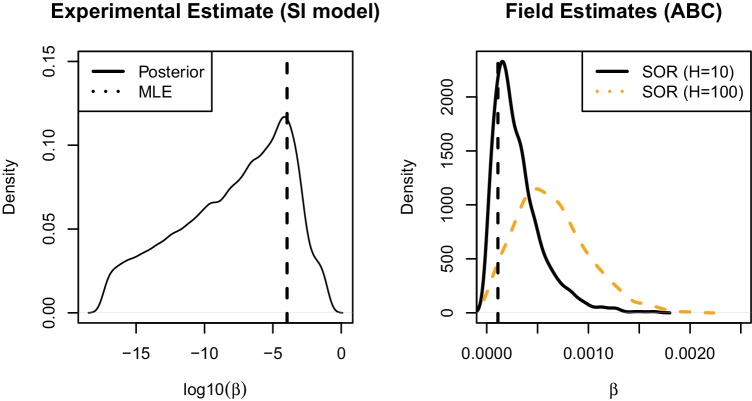
Appendix 3—figure 1. Posterior estimates of rates of cattle-to-cattle transmission from Weybridge pilot study (Left) Posterior distribution and maximum likelihood estimate for frequency dependent transmission rate () calculated from final size distribution (Khatri et al., 2012.
(Right) Posterior predictive distributions for effective (frequency dependent) transmission parameter () from field estimates of the SOR transmission model with an assumed herd size of 10 (black) and 100 (orange, dashed). MLE estimate from Weybridge pilot study is show by vertical black dashed line.

