. 2018 Jun 5;7:e27694. doi: 10.7554/eLife.27694

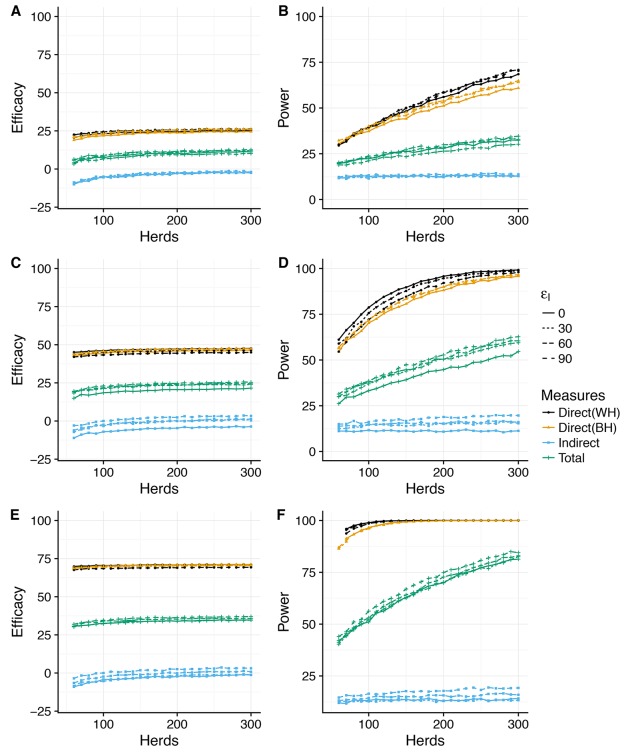
Figure 2. Power to estimate Direct, Indirect and Total efficacy from a two-level design (SORI model).

Expected values of the Direct, Indirect and Total vaccine efficacies measured from a two-level design with trial duration of 3 years and with 75% of herds vaccinated at 50% and 25% of herds as unvaccinated whole-herd controls. We explore a range of assumed vaccine-induced reductions in susceptibility (A,B) εS=30%, (C,D) εS=30%, (E,F) εS=90%) and infectiousness (Linetype, εI=0,30,60,90%). The expected effect sizes (A,C,E) are illustrated by the median of the posterior predictive distribution for each measure. Power (B,D,F) is calculated using a classical hypothesis test on the relative risk of infection (RR) in vaccinated compared to unvaccinated animals (described fully in Materials and methods section). Note that in this design Direct Efficacy can be estimated relative to either within-herd (WH) or between-herd (BH) control animals. 100 herds provides >90% power to estimate a protective direct efficacy for a true efficacy of 60%; however, >150 herds are required to achieve an 80% power to estimate a true efficacy of 30%. The indirect efficacy is predicted to be close to zero as the extrinsic force of infection acting on herds overwhelms the indirect protection provided by immunity within the herd. There is a ~50% probability of estimating a negative indirect efficacy of vaccination across the number of herds explored. As a consequence of the minimal indirect protection offered by vaccination, the Total Efficacy of vaccination with herds with 50% coverage is approximately half that of the direct efficacy. The model predicts that a 90% power of estimating a positive Total Efficacy would require >300 herds for a true direct efficacy of 60%.

Figure 2.

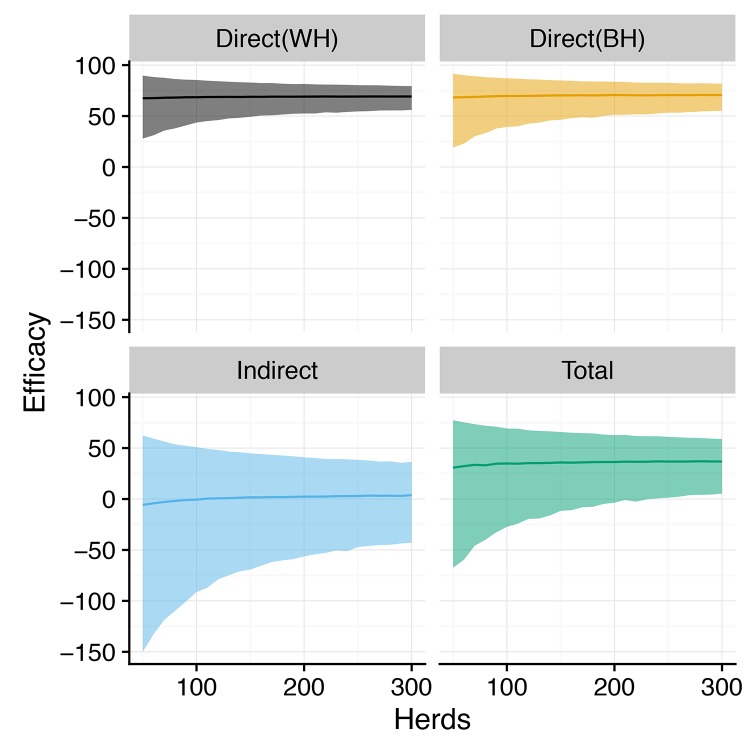
Figure 2—figure supplement 1. Posterior predictive distributions for Direct, Indirect and Total efficacy from two-level design (SORI model).

Figure 2—figure supplement 1.

Posterior predictive distributions for the direct, indirect and total vaccine efficacy (effect size) as estimated by relative risk ratios plotted against the number of trial herds for a 3-year trial duration. Direct efficacy is estimated in two ways using within-herd (WH) and between-herd (BH) controls. Median effect size is plotted as a solid line, with shaded region illustrating 95% credible intervals. Plotted distributions are for the most optimistic scenario of an assumed reduction in susceptibility and infectiousness of εI,εI=90%. While the 95% credible interval for the effect size remains comfortably above zero for both measures of direct efficacy, there is a substantial risk of estimating a erroneous negative indirect and total efficacy of vaccination even for this most optimistic scenario.

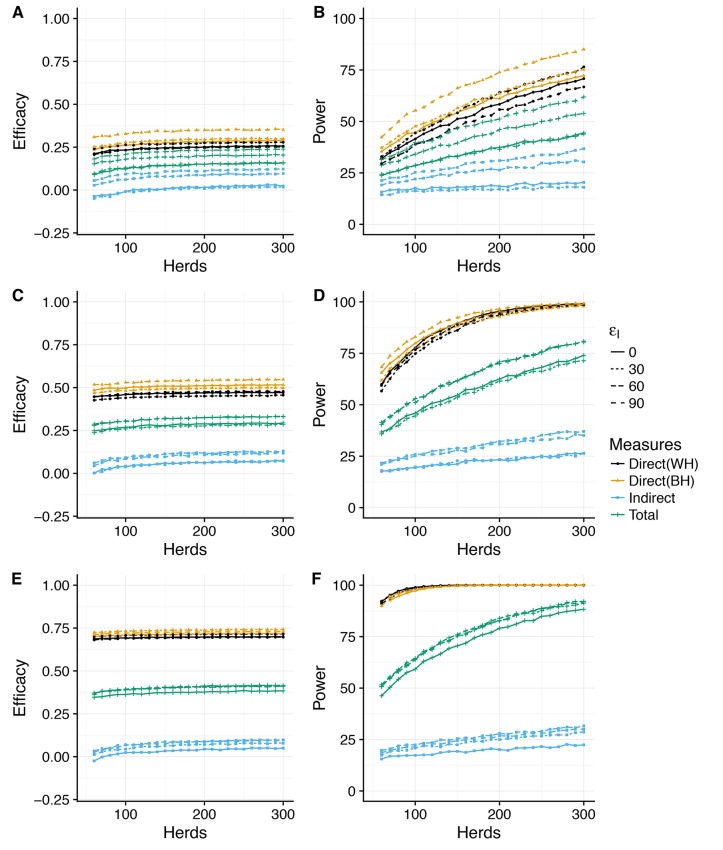
Figure 2—figure supplement 2. Power to estimate Direct, Indirect and Total efficacy from two-level design (SOR model).

Figure 2—figure supplement 2.

Expected values of the Direct, Indirect and Total efficacies of vaccination using a two-level design with 50% of herds vaccinated at 25% and 25% of herds as unvaccinated whole-herd controls. We explore a range of assumed vaccine-induced reductions in susceptibility (A,B) εS=30%, (C,D) εS=60%, (E,F) εS=90%) and infectiousness (Linetype, εI=0, 30, 60, 90%). The expected effect sizes (A,C,E) are illustrated by the median of the posterior predictive distribution for each measure. Power (B,D,F) is calculated using a classical hypothesis test on the relative risk of infection (RR) in vaccinated compared to unvaccinated animals (described fully in Materials and methods section). Note that in this design, Direct Efficacy can be estimated relative to either within-herd (WH) or between-herd (BH) control animals. 100 herds provides >90% power to estimate a protective direct efficacy for a true efficacy of 60%, however >150 herds are required to achieve an 80% power to estimate a true efficacy of 30%. For the SOR model, the indirect efficacy is predicted to be ~10% as a consequence of the greater instantaneous number of infectious animals within herds as compared to the SORI model. This predicted effect size is still small and as such there is still only a 70% power of estimating a positive indirect efficacy for a study size of 300 herds. Power to estimate the Total Efficacy is likewise increased with a >90% chance of estimating a positive Total Efficacy from 300 herds.

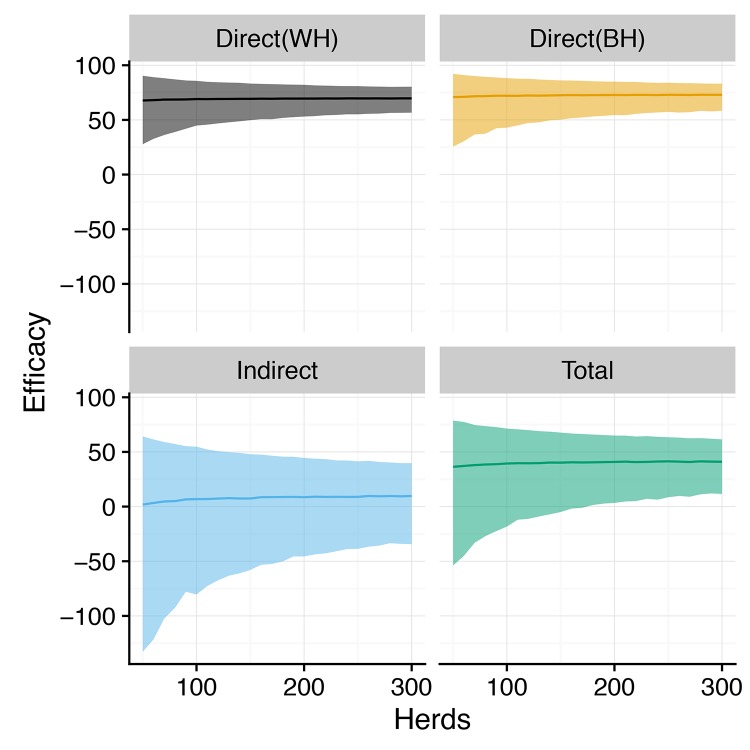
Figure 2—figure supplement 3. Posterior predictive distributions for Direct, Indirect and Total efficacy from two-level design (SOR model).

Figure 2—figure supplement 3.

Posterior predictive distributions for the direct, indirect and total vaccine efficacy (effect size) as estimated by relative risk ratios plotted against the number of trial herds for a 3-year trial duration. Direct efficacy is estimated in two ways using within-herd (WH) and between-herd (BH) controls. Median effect size is plotted as a solid line, with shaded region illustrating 95% credible intervals. Plotted distributions are for the most optimistic scenario of an assumed reduction in susceptibility and infectiousness of εS,εI=90%. While the 95% credible interval for the effect size remains comfortably above zero for both measures of direct efficacy, there is a substantial risk of estimating a erroneous negative indirect and total efficacy of vaccination even for this most optimistic scenario.