. 2018 Jun 5;7:e27694. doi: 10.7554/eLife.27694

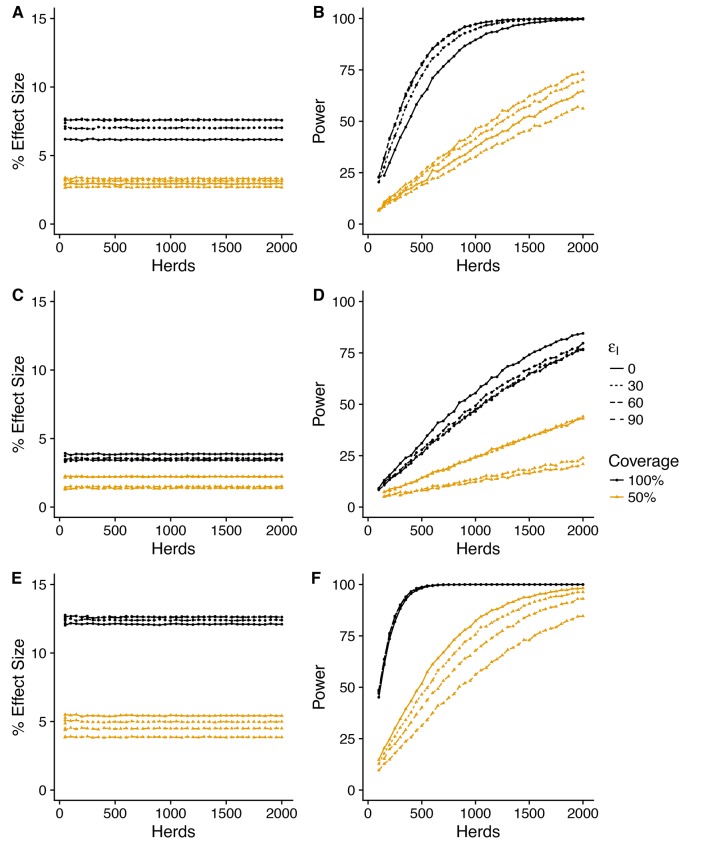
Figure 4. Power to estimate effect of vaccination on herd level incidence (SORI model).

Simplest design to measure vaccine effectiveness with 50:50 mix of control and vaccinated herds and a target coverage of either 50% or 100% for a 3-year trial period. We explore a range of assumed vaccine-induced reductions in susceptibility (A,B) εS=60%(C,D) εS=60%(E,F) εS=90% and infectiousness (εI=0, 30, 60, 90%). For an assumed vaccine efficacy of 90% (reduction in susceptibility), the SORI model predicts a ~ 10% reduction in herd level incidence (defined as the proportion of herds with at least one DIVA test positive animal or slaughterhouse case) for 100% vaccination coverage and ~ 5% for 50%. For this effect size ~ 500 herds would be required to achieve the target 80% trial power for whole herd vaccination. In excess of 2000 herds (the upper range considered) would be required for a 50% within herd target coverage.

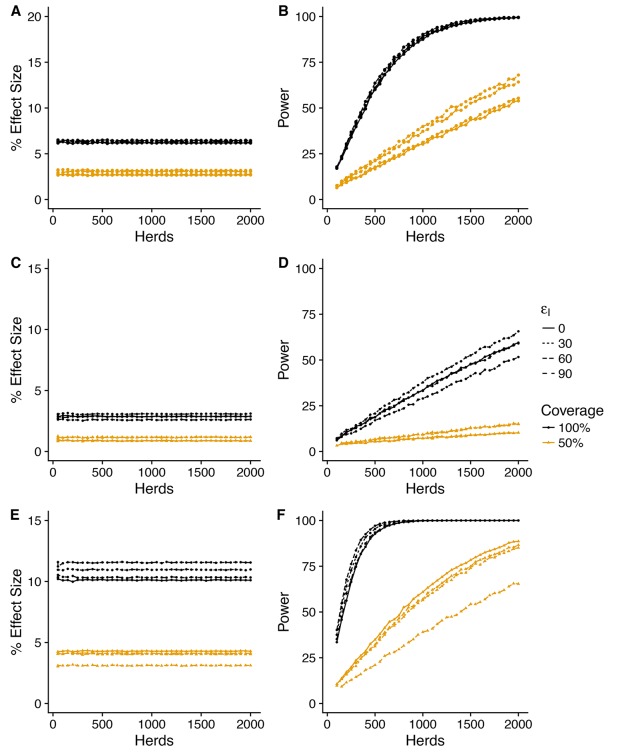
Figure 4.

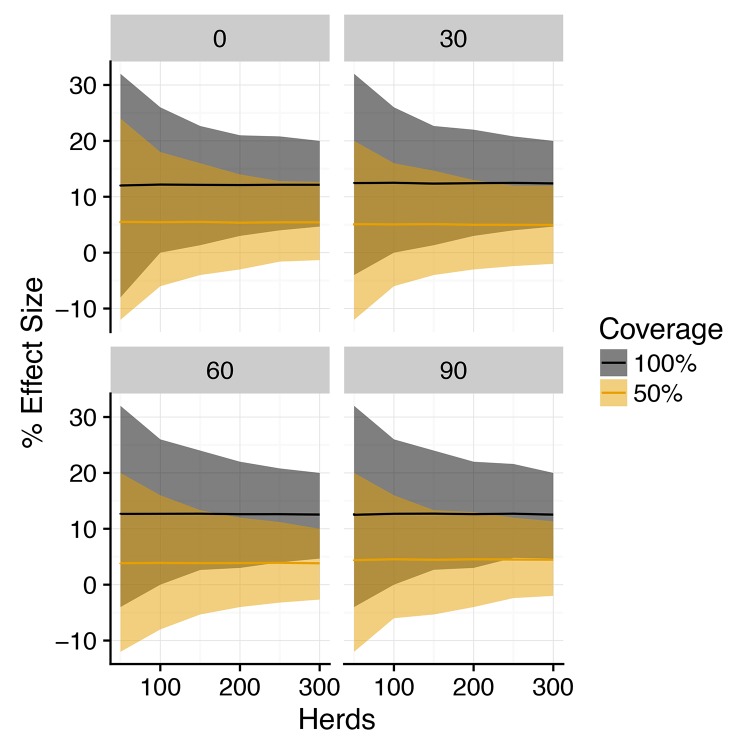
Figure 4—figure supplement 1. Posterior predictive distribution for effect size of vaccination on herd level incidence (SORI model).

Figure 4—figure supplement 1.

Posterior predictive distribution of the % difference in incidence (effect size) between vaccinated and control herds for a three-year trial duration for the SORI model plotted against herd size. Median value is plotted as a solid line, with shaded region illustrating 95% credible intervals for 100% within-herd target coverage of vaccination (black) and 50% target coverage (orange). Plotted distributions are for an assumed reduction in susceptibility of εS=90% and the reduction in infectiousness as indicated in the heading of each panel.
Figure 4—figure supplement 2. Predicted effect of vaccination on herd level incidence (SOR model).

Figure 4—figure supplement 2.

Simplest design to measure vaccine efficiency with 50:50 mix of control and vaccinated herds and a target coverage of either 50 or 100% for a 3-year trial period. We explore a range of assumed vaccine-induced reductions in susceptibility (A,B) εS=60%(C,D) εS=60%(E,F) εS=90% and infectiousness (εI=0, 30, 60, 90%). For an assumed vaccine efficacy of 90% (reduction in susceptibility) the SOR model predicts a ~ 12% reduction in herd level incidence (defined as the proportion of herds with at least one DIVA test positive animal or slaughterhouse case) for 100% vaccination coverage and ~ 5% for 50%. For this effect size, ~ 500 herds would be required to achieve the target 80% trial power for whole herd vaccination. In excess of 1500 herds would be required for a 50% within herd target coverage.
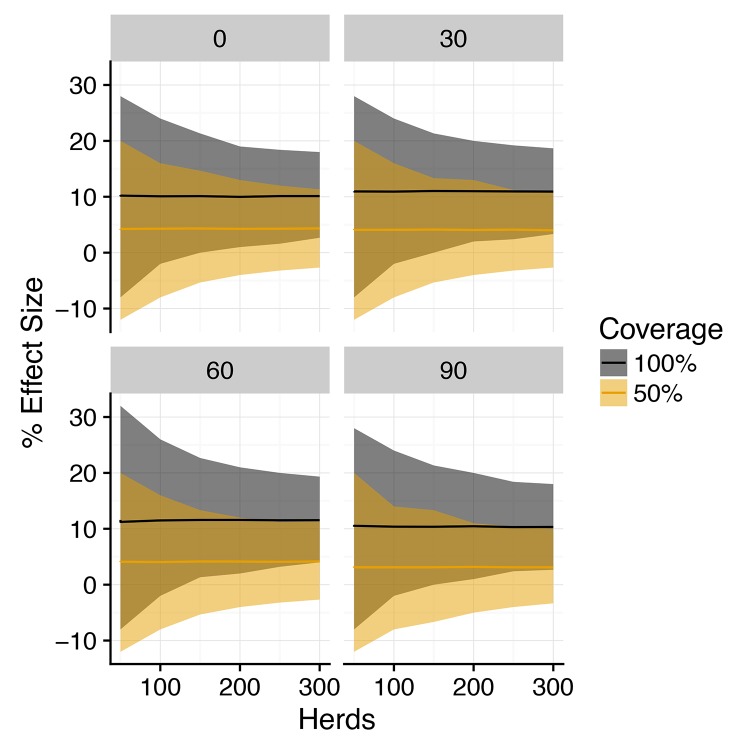
Figure 4—figure supplement 3. Posterior predictive distribution for effect size of vaccination on herd level incidence (SOR model).

Figure 4—figure supplement 3.

Posterior predictive distribution of the % difference in incidence (effect size) between vaccinated and control herds for a 3-year trial duration for the SOR model plotted against herd size. Median value is plotted as a solid line, with shaded region illustrating 95% credible intervals for 100% within-herd target coverage of vaccination (black) and 50% target coverage (orange). Plotted distributions are for an assumed reduction in susceptibility of εS=60% and the reduction in infectiousness εI as indicated in the heading of each panel.