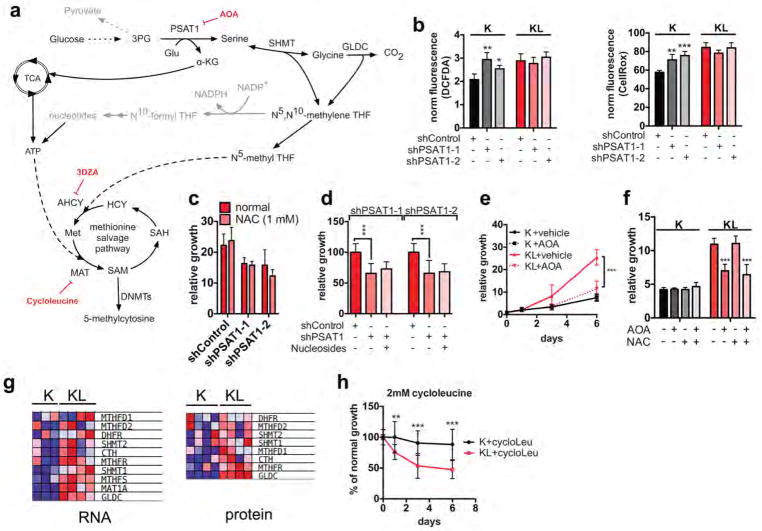
Extended Data Figure 4. Characterization of serine-glycine one-carbon pathway in KL cells.
a, Detailed graph of SGOC network. Enzymatic inhibitors used in this study are marked in red. b, Reactive oxygen species in K or KL cells transduced with shControl, shPSAT1-1 or shPSAT1-2 were measured by DCFDA (left) and CellRox staining (right). Data are normalized to cell number (n=4). c, Six-day proliferation assay of KL cells transduced with shControl, shPSAT1-1 or shPSAT1-2, showing lack of growth rescue by N-acetylcysteine (NAC). Data are expressed as relative to day 0 (n=6). d, Three-day growth assay of KL cells transduced with shControl, shPSAT1-1 or shPSAT1-2, showing the lack of rescue by excess nucleosides (adenosine, guanosine, thymidine, uridine, cytidine, 1 mM each). Data are presented as percentage of the growth of shControl cells (n=16). e, Proliferation of K or KL cells treated with aminooxyacetate (AOA). Data are expressed as relative to day 0 (n=8). f, Five-day proliferation of K or KL cells treated with AOA and/or NAC. Data are expressed as relative to day 0 (n=6). g, Data from RNA-seq (left panel) and quantitative proteomics (right panel) showing levels of genes involved in the production of SAM in K and KL. The data plotted are expressed as mean-centered values. h, Proliferation of K or KL cells treated with 2 mM cycloleucine. Data are expressed as percentage of the growth of vehicle treated cells (n=12). Shown are data pooled from two (b–f, h) experiments. For all panels, error bars are standard deviation unless otherwise stated and statistical significance is indicated as follows: *P<0.05, **P<0.01, ***P<0.001.

