
Figure 2.
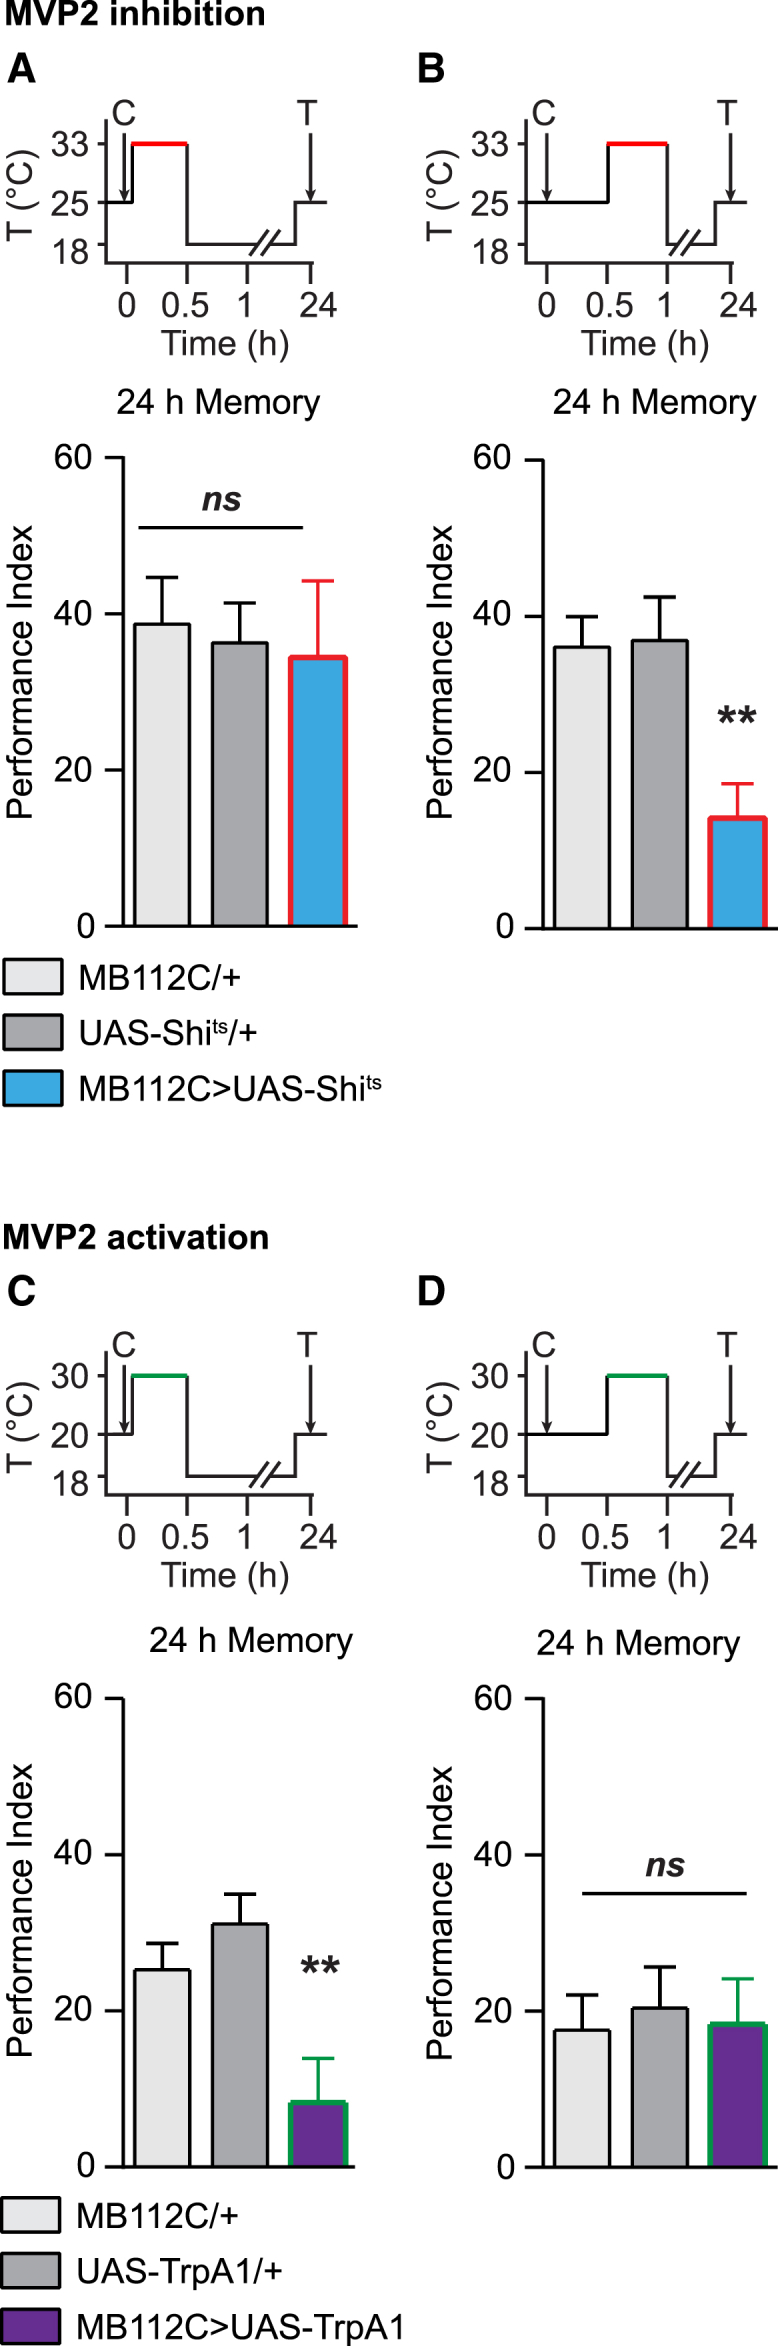
MVP2 Activity Is Necessary for Appetitive LTM Formation
(A and B) In (A), MVP2 inhibition from 0 to 0.5 hr did not affect LTM (n = 12), F(2, 33) = 0.09, p = 0.92; whereas in (B), MVP2 inhibition from 0.5 to 1 hr impaired LTM (n = 18), F(2, 51) = 7.58, p < 0.01. As expected, blocking MVP2 output for the period including the 0.5- to 1-hr period post-conditioning impaired LTM, whereas LTM was normal at a permissive temperature as well as when MVP2 output was blocked 1.5 hr after conditioning (see Figures S2A–S2D). When MVP2 output was blocked immediately after conditioning, 2-hr memory was normal (see Figure S2E).
(C and D) In (C), MVP2 activation from 0 to 0.5 hr impaired LTM (n = 18), F(2, 51) = 7.30, p < 0.01; whereas in (D), MVP2 activation from 0.5 to 1 hr did not affect LTM (n = 12), F(2, 33) = 0.08, p = 0.93.
Time courses of temperature shifts are displayed above the performance index histograms (C, conditioning; T, test). Red or green periods in the time courses represent when neurotransmission was blocked (Shits experiments) or activated (TrpA1 experiments), respectively. Error bars indicate mean ± SEM. Statistical tests were performed using one-way ANOVA. ∗∗p < 0.01, in post hoc comparison; ns, not significant.