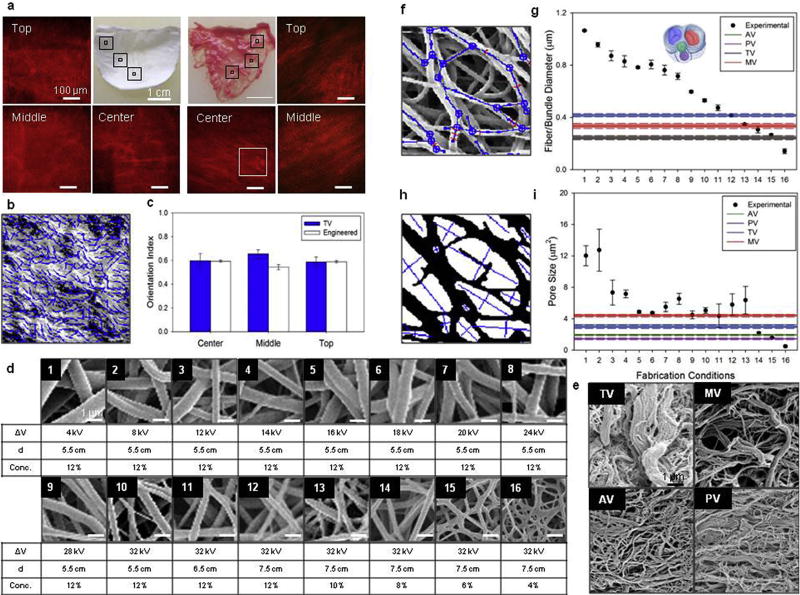
Fig. 8. DCD process control on engineered valve microstructure.
a) Engineered valve leaflet fiber alignment over 3D was studied by multi-photon microscopy. Image stacks of 500 × 500 × 100 µm were analyzed at five different locations within the valve leaflet: top left and top right, center and a middle transition zone between the two (mid-leaflet left and mid-leaflet right). For comparison the same imaging and digital analysis technique was applied to native porcine TV leaflets. b) Detail (inset from figure a), of fiber orientation detection algorithm applied to collagen fibers second harmonic generation. c) The level of fiber alignment in terms of the orientation index (OI) was quantified for both valve types and the top and mid-leaflet data combined (Supplemental Fig. 1). Native vs. engineered valve fiber OI comparison showed levels of fiber alignment (OI = 0.57–0.62) in engineered valve leaflets not statistically different from the native valve. Valve leaflets detailed 2D micro-architecture (Supplemental Figs. 2–4) was characterized by scanning electron microscopy d–e) and image analysis identifying fiber network f) and pores geometry h). Fiber diameter and pore size for valve scaffolds fabricated at different processing conditions are provided in figure g) and i) respectively (the overlapping fiber bundle diameter range for AV and PV shown as grey). Values were compared with native valve fiber bundle diameter showing the DCD capacity to recapitulate native tissue micro-architecture.

