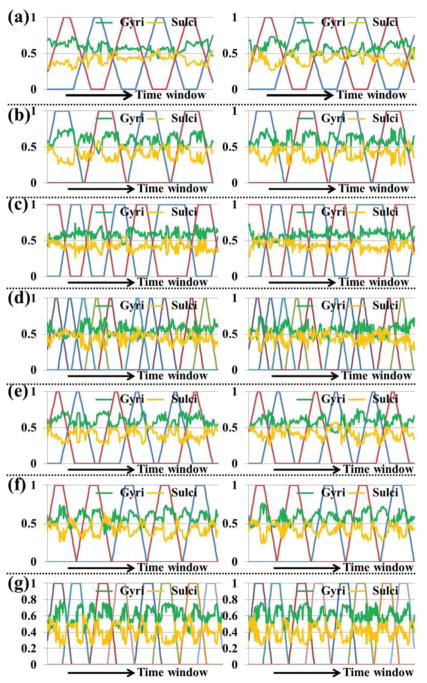
Fig. 9.
The temporal dynamic distribution percentage of SOPFNs on gyri (green curve) and sulci (orange curve) across all time windows in the two groups of the seven tasks shown in (a)-(g), respectively. In each sub-figure, the horizontal axis is the time window and the vertical axis is the distribution percentage value. The details of task design curves (represented by different colors) are in Supplemental Fig. 2. Note that the task design curves are not convoluted with hemodynamic response function for a better visualization. Note that at a specific time window, the sum of percentage values of gyri and sulci equals 1.

