
Figure 2.
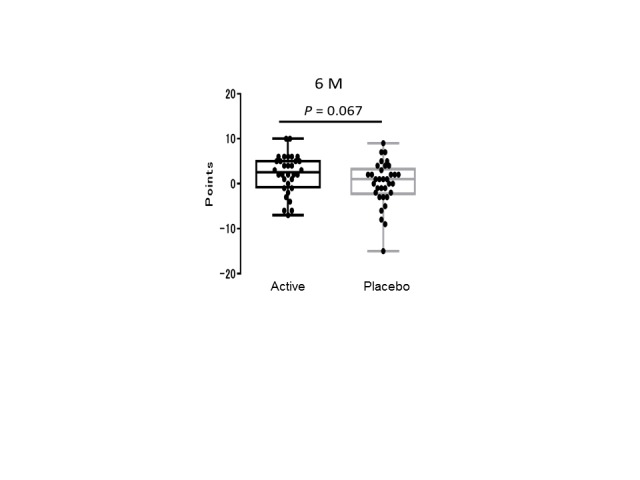
Longitudinal changes in WMS-LM2 scores at the mid-term test. A box plot of the change of WMS-LM2 story A data (the score of 6-month test - the score of the initial test) in the active and placebo groups. Each black dot indicates the difference between the first and final test scores for one volunteer. Box shows the 25-75 percentile, and solid bar shows the median.