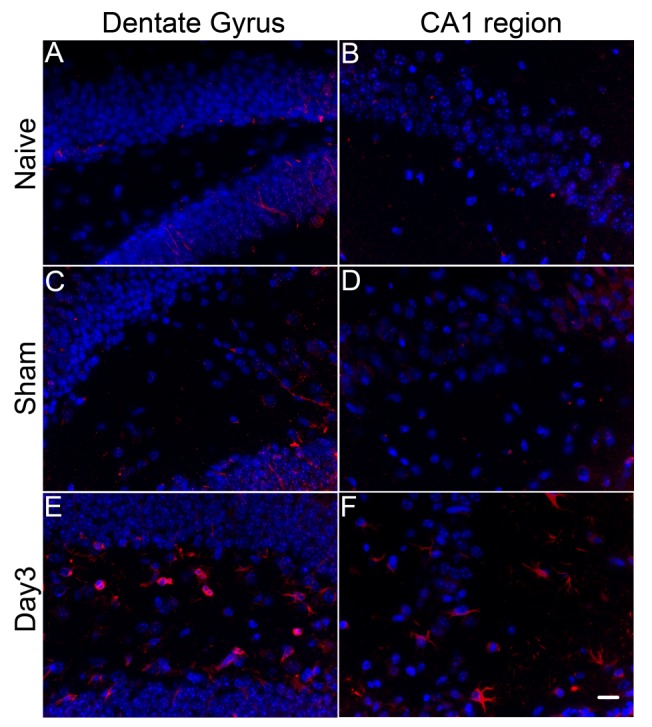
Figure 6.

Spatial distribution of CD45+ cells in brain parenchyma. Immunohistochemical staining reveals that major changes in CD45+ immunoreactivity (red) occur in the dentate gyrus (A, C, E) and hippocampal CA1 region (B, D, F). Cell nuclei are co-stained by DAPI (blue). In naïve (A and B) and sham operated (C and D) mice, strongly CD45 positive cells are scarce. On Day 3 after cardiac arrest and resuscitation, there is a significant increase in the number of CD45+ cells in dentate gyrus and CA1 region. The strongly positive immmunoreactivity in E-F as compared to that in A-D is likely related to the CD45+hi subpopulation in Figure 5. (Scale bar = 15 μm).
