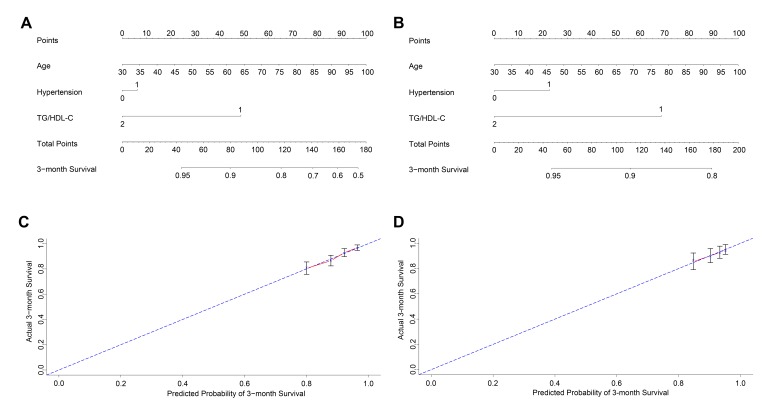
Figure 4.
Nomogram of the study population to predict 3-month survival in acute ischemic stroke. The nomogram is used by summing the points assigned to the corresponding factors, which are presented at the top of the scale. The total is used to predict the 3-month probability of survival in the lowest scale. The c-indexes values for the training (A) and the test cohort (B) are 0.684 and 0.670, respectively. Individual patients were divided into low (<0.90)- and high (≧0.90)-level groups according to the TG/HDL-C cutoff. Calibration curves for 3-month survival, which are representative of predictive accuracy, for the training (C) and the test cohort (D). The 45-degree reference line represents a perfect match between predicted and observed values.

