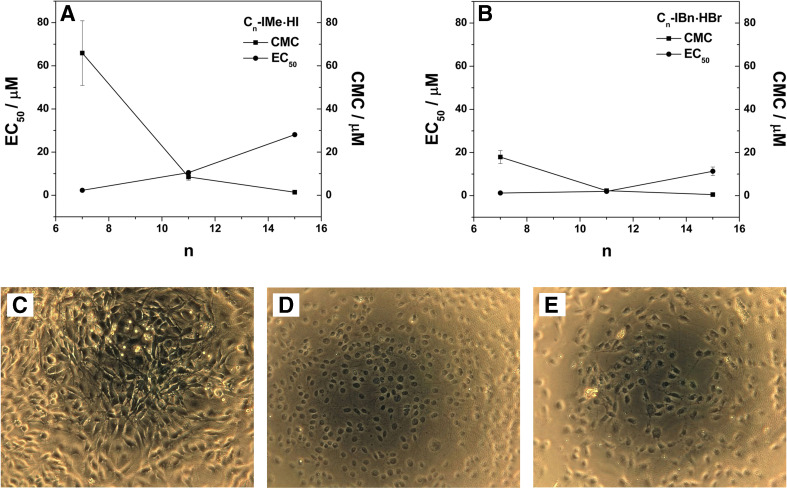
Fig. 3.
Cellular interactions of Cn-IMe·HI and Cn-IBn·HBr (n = 7, 11, 15). Both CMC and EC50 values against C6 glioma cell line plotted as a function of the number of carbon atoms (n) in each alkyl chain for a Cn-IMe·HI and b Cn-IBn·HBr (n = 7, 11, 15). Microscopy-phase-contrast images of C6 glioma cells: c untreated, d treated by 1% Triton X-100 for 10 min and e treated by 100 μM C11-IMe·HI for 24 h. Modified from Wang et al. (2015a, b)

