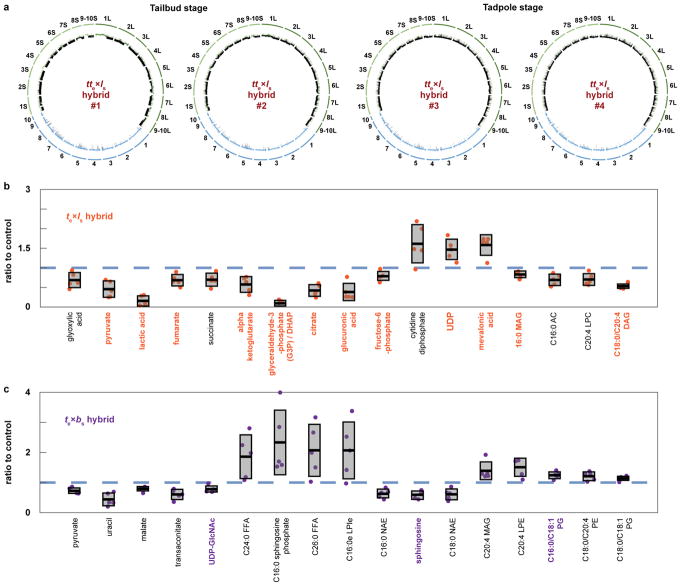
Extended Data Figure 3. Whole genome sequencing of tte×ls rescued embryos and metabolomic profiling of te×ls and te×bs hybrid embryos.
a, The genomes of 4 tte×ls rescued embryos were sequenced, aligned, and normalized to the genomes of X. tropicalis (blue) and X. laevis (green) for which sub-genomes S and L were distinguished (S in light green and L in dark green). Underrepresented regions of the genomes are color-coded in black. The tte×ls embryo genomes 1–2 were prepared from tailbuds, and 3–4 from tadpoles. b, Metabolites differentially represented between te×ls hybrid and X. tropicalis embryos 7 h post fertilization. Among the 179 metabolites detected, 17 were significantly altered in te×ls hybrid embryos (p < 0.05; two-tailed homoscedastic t-test; individual p-values are provided in Figure 3c source data) and are shown as a ratio to the X. tropicalis control (blue dashed line). Levels were obtained from 5 samples from 3 independent fertilizations each. Values for the te×ls hybrid are plotted in orange. The averages are shown as thick lines and the gray boxes correspond to 1 standard deviation. 95% confidence intervals are, from left to right, 0.69±0.24, 0.46±0.26, 0.16±0.16, 0.68±0.18, 0.70±0.21, 0.58±0.25, 0.10±0.09, 0.42±0.19, 0.38±0.27, 0.79±0.15, 1.61±0.61, 1.47±0.33, 1.58±0.33, 0.83±0.11, 0.71±0.18, 0.70±0.19, and 0.53±0.08. Metabolites with p values below the penalized Bonferroni corrected threshold (n = 12) are labeled in orange. c, Metabolites differentially represented between te×bs hybrid and X. tropicalis embryos 7 h post fertilization. Among the 241 metabolites detected, 17 were significantly altered in te×bs hybrid embryos (p < 0.05; two-tailed homoscedastic t-test; individual p-values are provided in Figure 4g source data) and are shown as a ratio to the X. tropicalis control (blue dashed line). Levels were obtained from 5 samples from 3 independent fertilizations, each. Values for the te×bs hybrid are plotted in purple. The averages are shown as thick lines and the gray boxes correspond to 1 standard deviation. 95% confidence intervals are, from left to right, 0.73±0.12, 0.44±0.26, 0.80±0.10, 0.61±0.21, 0.78±0.14, 1.86±0.9, 2.33±1.33, 2.07±1.07, 2.07±1.17, 0.63±0.19, 0.59±0.16 0.61±0.22, 1.39±0.37, 1.51±0.38, 1.24±0.14, 1.21±0.18, and 1.14±0.10. Metabolites with p values below the penalized Bonferroni corrected threshold (n = 3) are labeled in purple.

