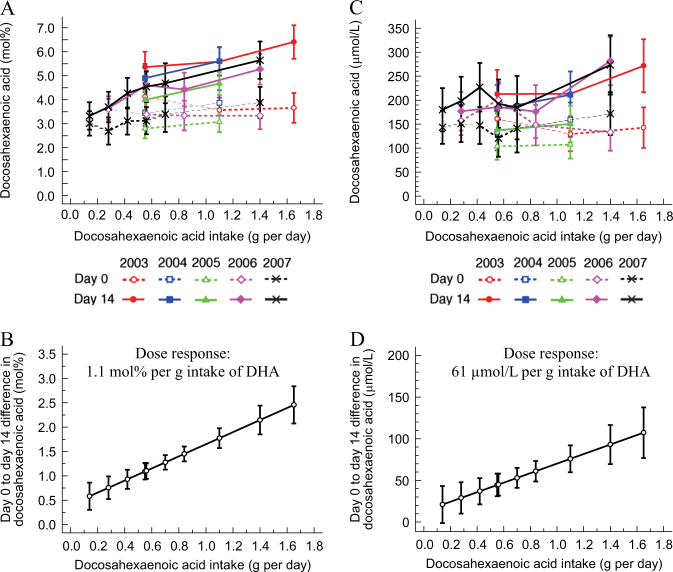
Fig. 2.
Effect of fish oil supplementation on a the molecular percent (mol %) and b concentration (µmol/L) of DHA in plasma phosphatidylcholine (PC). Values are unadjusted means (95% CI) of the change, from days 0 to 14, in the mol % and µmol/L of DHA in plasma PC and are shown by dose of DHA intake and by year in which the study was conducted. The point estimates occur at the particular doses used in each year. Values are predicted means (95%CI) calculated by regressing the dose of DHA on the change, from days 0 to 14, in the mol % and µmol/L of DHA in plasma PC with adjustment for year of study and baseline DHA composition of plasma PC. The point estimates shown on the graph were calculated for each dose of DHA intake (g/d) on the c mol % and d µmol/L

