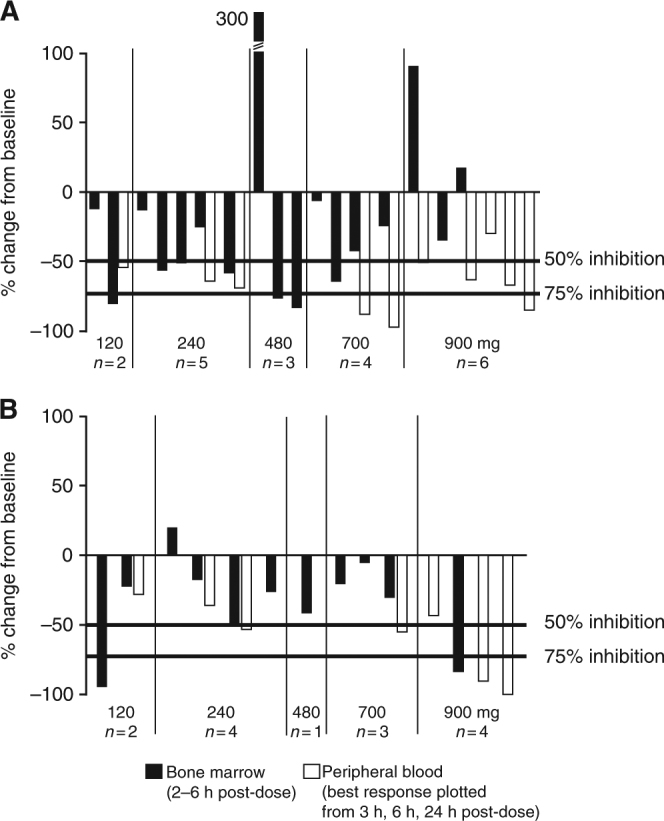
Fig. 2.

PD response to AZD1208 treatment in the AML dose-escalation study. The percentage of change from baseline in the reduction of (a) pBAD S112, and (b) p4E-BP1 S65 in bone marrow and peripheral blood samples collected following a single dose of AZD1208 is shown. Only the maximal PD response measured on Day 1 for peripheral blood samples is shown. Each column represents an individual patient, with adjacent columns corresponding with matched marrow and blood samples. AML, acute myeloid leukaemia; PD, pharmacodynamics
