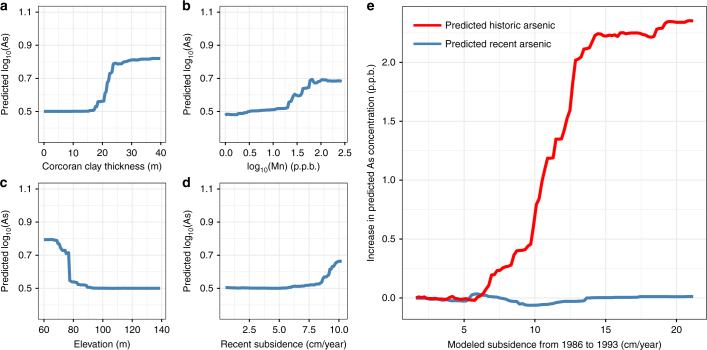
Fig. 2.
Partial dependence plots of primary descriptors of groundwater arsenic concentrations. These include a confining clay thickness, b dissolved Mn concentrations, c elevation, and d recent subsidence. e Comparison of partial dependence plots of historic and recent subsidence. Note that historic subsidence has a great effect on historic arsenic levels but little effect on recent arsenic levels (e), whereas recent subsidence has a great effect on recent arsenic levels (d). All blue lines are derived from models predicting recent (2007–2015) arsenic concentrations, whereas the red line is derived from models predicting historic (1986–1993) arsenic concentrations

