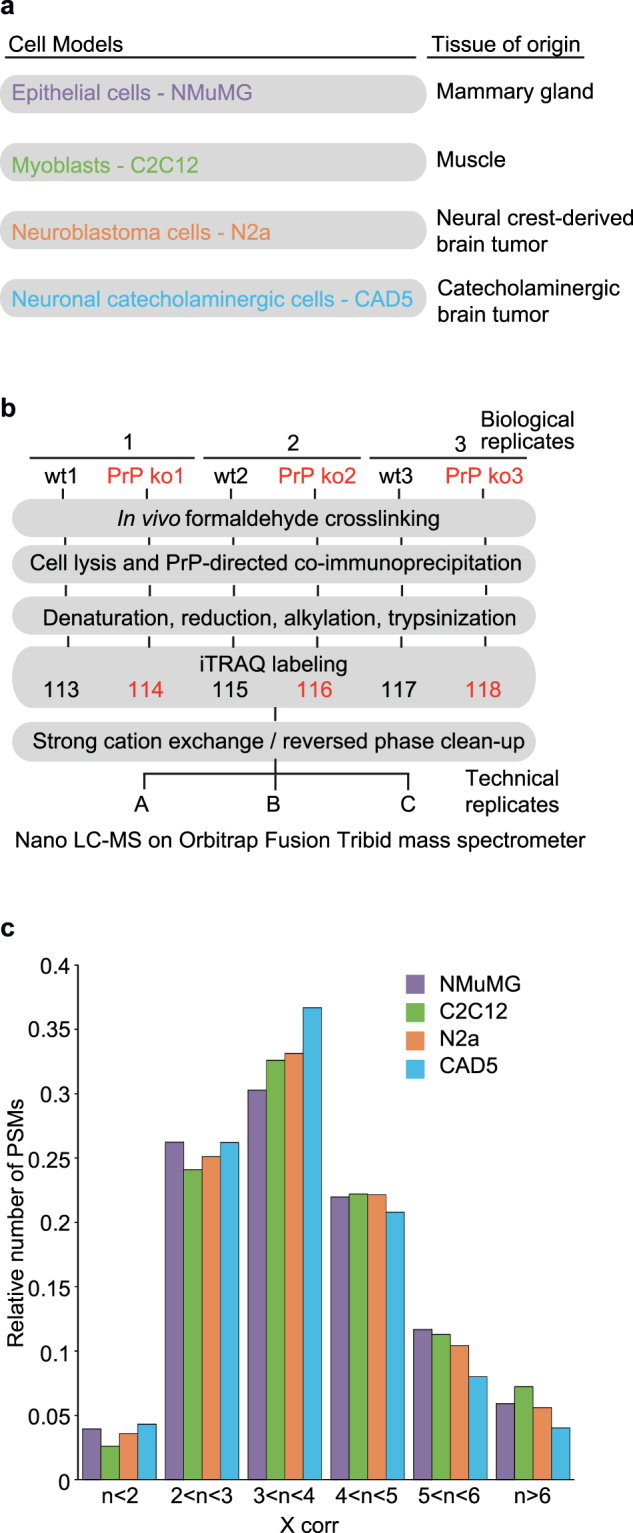
Figure 1.

Design of comparative PrP interactome study. (a) Models used in this study. (b) Flow-chart depicting workflow of quantitative interactome analyses. Note that for the NMuMG cell model, one additional step was inserted into the workplan, namely a 48-hour addition of Tgfb1 to the cell culture medium, which causes the cells to acquire mesenchymal morphology. (c) Similar SEQUEST X corr stratifications of the four cell type-specific PrP interactome datasets indicated comparable data quality.
