Figure 2.
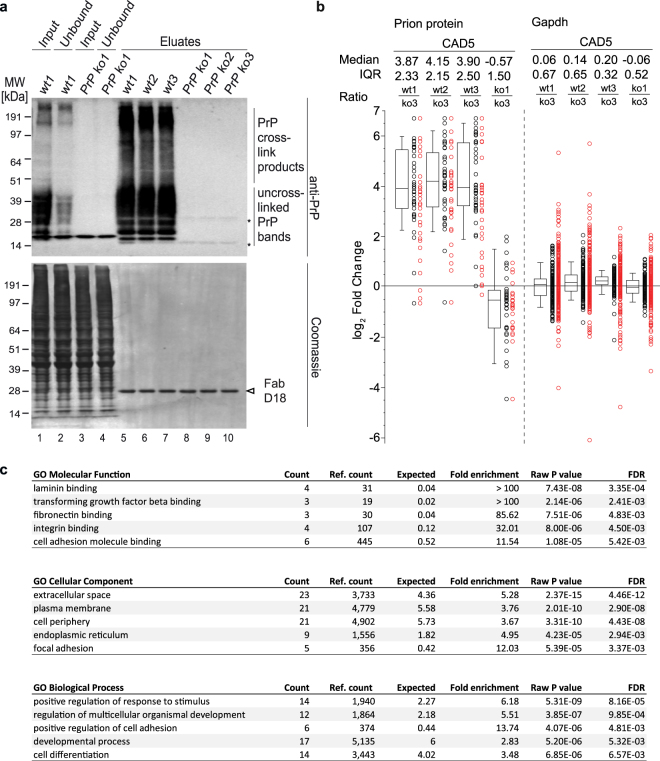
Validation of successful technical execution of quantitative interactome analysis. Analyses of benchmarks of PrP co-immunoprecipitation, iTRAQ quantitation and GO enrichment. (a) Western blot validation of co-immunoprecipitation of endogenous PrPC from NMuMG cell extracts. Strong depletion of PrP-related signals in the unbound fraction and its robust enrichment in wild-type eluate fractions. Asterisks denote weakly detected cross-reactive bands. (b) Box plot depicting selective detection of PrP in wild-type eluate samples of CAD5 cell-derived PrP immunoaffinity captures but not in negative control PrP knockout eluates (see Supplementary Figure S1. for the respective PrP box plots from NMuMG, C2C12 and N2a cells). The box plot depicts in log2 space enrichment ratios of individual PrP peptides used for quantitation. The computed Median peptide ratios and Inter Quartile Ranges (IQR) are shown above the graph. Note that a subset of PSMs (indicated with red circles) were automatically eliminated from the quantitation, either because their identification was redundant or as a consequence of mass spectrometry profiles underlying their identification not passing stringency thresholds. In this and other box plots in this report relative protein levels are depicted as ratios, with ion intensities of the heaviest isobaric labels within multiplex analyses (representing one of 3 PrP knockout biological replicates) serving as the reference (denominator). (c) GO enrichment analyses of the 26 shortlisted PrP candidate interactors identified in this study.

