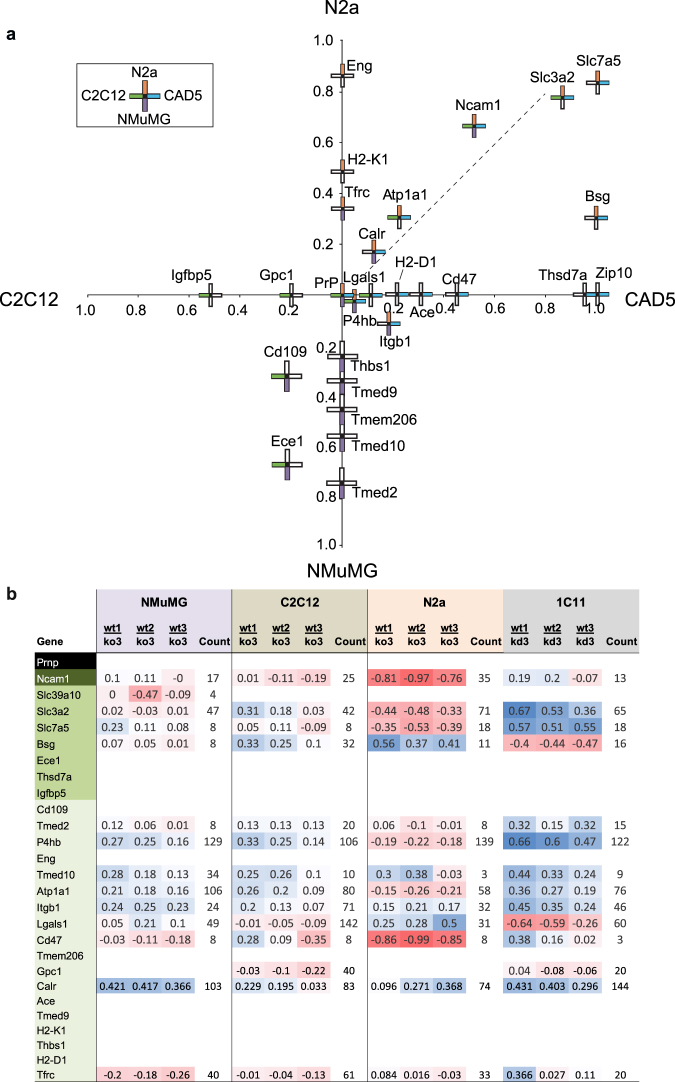
Figure 3.
The molecular environment of PrP is cell model-specific and comprises several novel candidate interactors. (a) Graph depicting relative enrichment levels of candidate PrP interactors by cell type. The x-coordinate of each protein is its average WT/PrP KO ratio in CAD5 minus its average WT/PrP KO ratio in C2C12. Each PrP interactor is represented by a cross, whose position in the coordinate system is determined by its relative enrichment in the four cell models, i.e., the y-coordinate represents the average WT/PrP KO ratios observed in N2a versus NMuMG cell PrP interactomes. The average WT/PrP KO ratios used were normalized against the average WT/PrP KO ratio for PrP in the same cell line. The cell lines in which a given protein was quantified are indicated by shading in the corresponding cross arms, proteins identified in all cell types are therefore represented by fully shaded crosses while proteins identified in only one cell type are represented by crosses with one shaded arm. At least one protein was enriched to an exceptional degree in each cell line. Eng was quantified only in the N2a interactome, and Igfbp5 was similarly quantified only in the C2C12 dataset, each protein being second only to PrP in its level of enrichment. The figure demonstrates that the two neuron-like cell lines (N2a and CAD5) share several PrP interactors which were only weakly detected or undetected in NMuMG or C2C12 datasets. Conversely Ece1 and Cd109 were highly co-enriched with PrP in NMuMG and C2C12 datasets but not N2a or CAD5 PrP interactomes. (b) Global proteome analyses of wild-type versus PrP-deficient cells indicates that PrP depletion has reproducible effects on steady-state protein levels of shortlisted PrP candidate interactors within a given model but leads to inconsistent consequences of their relative abundance across cell models.

