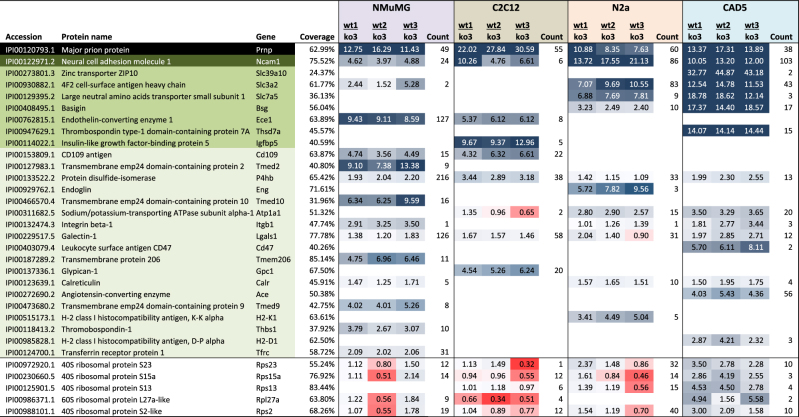
Table 1.
Curated list of PrP candidate interactors organized by cell type (please see Supplemental Table S1 for a complete account of shortlisted candidate interactors). Comparison of PrP interactome in four mouse cell models (list of non-specific interactors truncated, see also Supplementary Table S1). White background indicates proteins that were co-enriched in one cell model or individual biological replicates but were revealed to be non-specific interactors in other samples. Green-shading identifies PrP candidate interactors, with light green, medium intensity green and dark green designating proteins assigned to interactor categories I, II and III, respectively (see main text for details). Coverage: percent of primary structure covered by peptide-to-spectrum-matches in all four interactome analyses. Blue and red shadee numbers represent the relative average quantitations of co-purified proteins in wild-type (wt) versus Prnp knockout (ko) control samples. The indices following the ‘wt’ and ‘ko’ label identify the biological replicate. The count columns inform about the number of relative quantitations underlying the average iTRAQ enrichment ratios for each protein and cell model.

