Fig. 3.
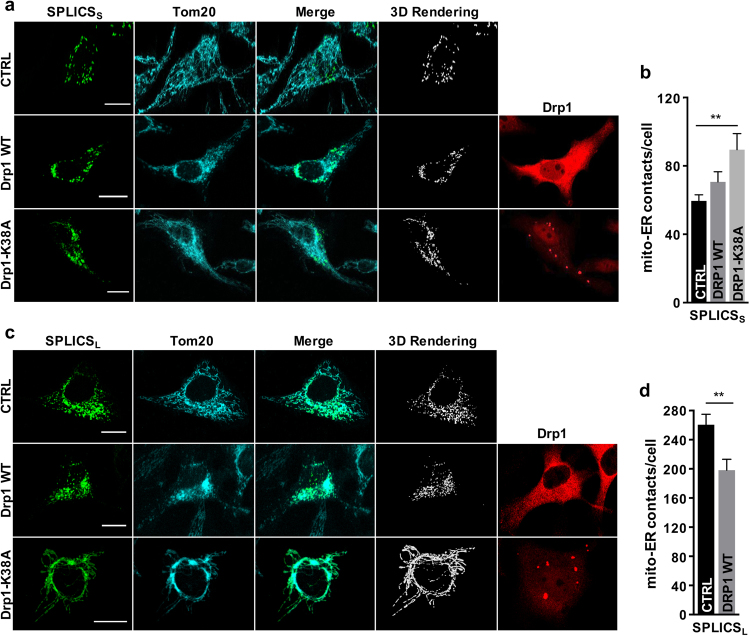
Effects of Drp1 overexpression on ER–mitochondria contacts. Immunofluorescence against mitochondria (Tom20, cyan) and Drp1 (red) is shown in the corresponding panels. The green channel is the merge of several planes. Scale bar 20 µm. a Representative confocal pictures of HeLa cells expressing the SPLICSS probe. b Quantification of SPLICSS contacts by 3D rendering of complete z-stacks. Mean ± SEM: Ctrl 59 ± 3, n = 79 cells; Drp1 WT 70 ± 5, n = 32 cells; Drp1-K38A 89 ± 9, n = 28 cells. c Representative confocal pictures of HeLa cells expressing the SPLICSL probe. d Quantification of SPLICSL contacts by 3D rendering of complete z-stacks. Mean ± SEM: Ctrl 260 ± 14, n = 24 cells; Drp1 WT 198 ± 14, n = 24 cells. Data shown are the result of 3–4 independent experiments. **p ≤ 0.01.

