Fig. 1.
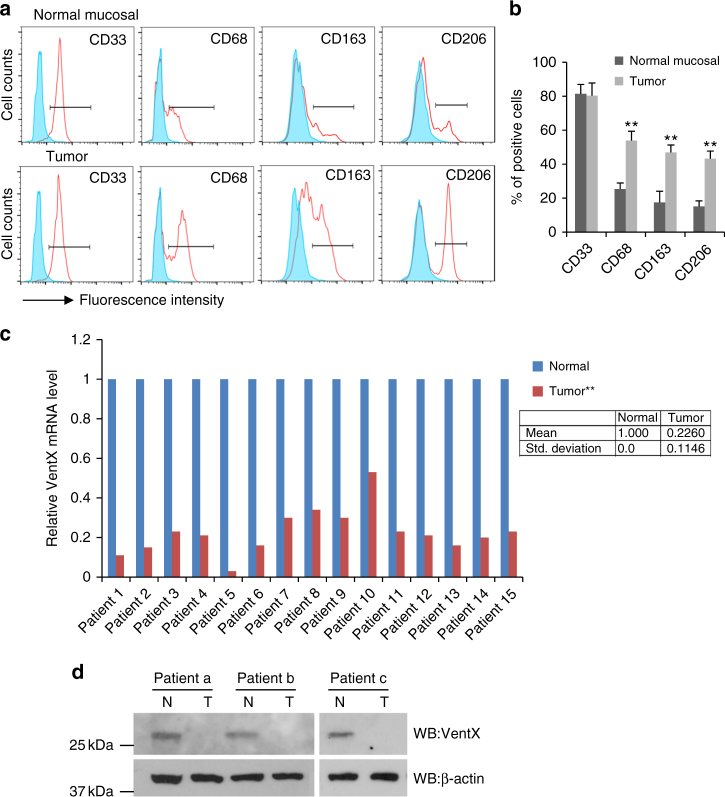
VentX expression is downregulated in TAMs. a, b FACS analysis and the percentage of surface expression of CD33, CD68, CD163, and CD206 on macrophages isolated from normal mucosa and tumors. Shaded peaks indicated isotope control. Representative figures of five independent experiments were shown, n = 5. Error bars represent SD and paired Student’s t-test was performed. **p < 0.01. c Paired comparison of RT-PCR measurement of VentX mRNA expression in macrophages isolated from normal control tissues and TAMs of 15 patients. The relative VentX mRNA expression levels in normal macrophages were arbitrarily designated as 1. Paired Student’s t-test was performed, **p < 0.01 TAMs vs. normal macrophages. Data shown in the box are mean ± SD of 15 patients. d Western blot analysis of endogenous VentX protein levels in macrophages isolated from normal control tissues and TAMs of three patients

