Fig. 3.
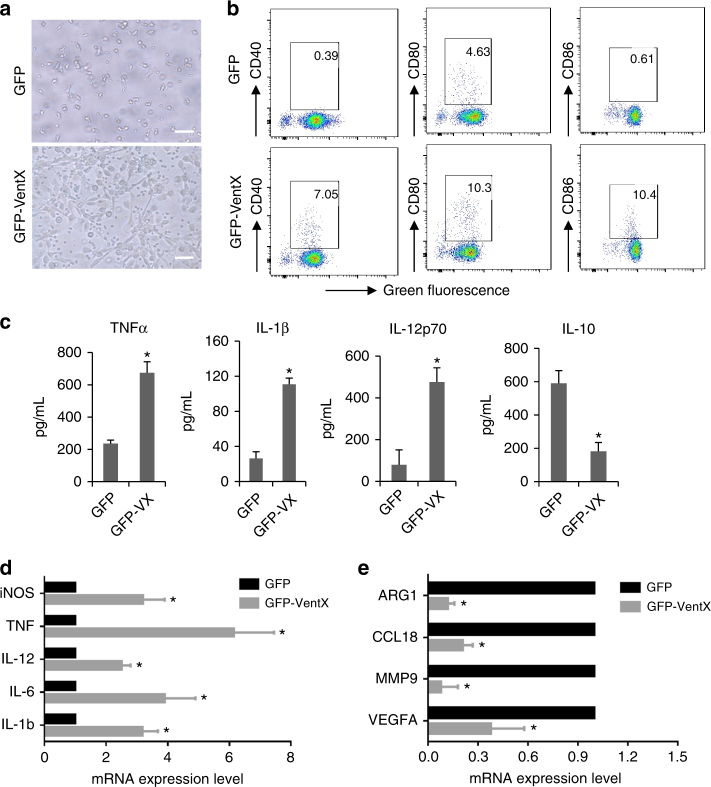
VentX polarizes TAMs towards M1 phenotype. a Morphology of TAMs transfected with GFP or GFP-VentX. Scale bar: 20 μm. b Surface expression of CD40, CD80, and CD86 in TAMs transfected with GFP or GFP-VentX as determined by flow cytometry analysis. Representative data of three independent experiments were shown. c ELISA measurement of secretion of pro-inflammatory cytokines in TAMs transfected with GFP and GFP-VentX. Results represent mean ± SD of four independent experiments and paired Student’s t-test was used. Expression of M1 (d) and M2 (e) macrophage markers in TAMs transfected with GFP or GFP-VentX as determined by qRT-PCR. Data shown are mean ± SD of three independent experiments and paired Student’s t-test was performed. *p < 0.05

