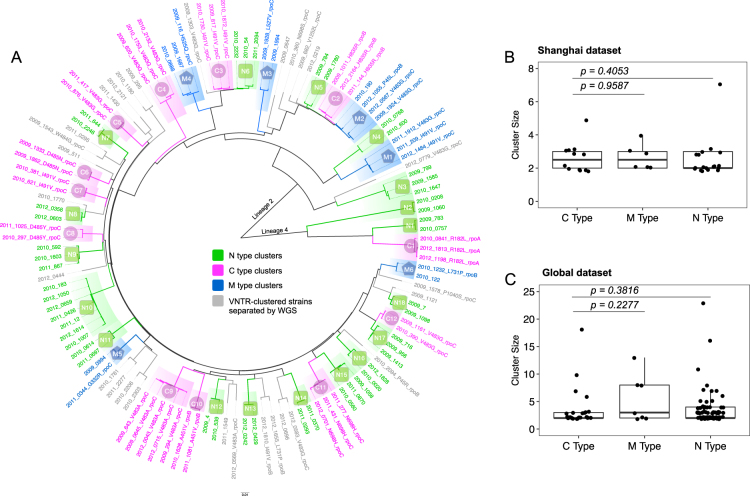
Fig. 2. Compensated MDR-TB strains were not associated with larger transmission clusters.
a A maximum likelihood phylogenetic tree showing genomic clusters in the Shanghai dataset. The strain identifiers were “year, strain number, and compensatory mutation type”. The three genomic cluster types are illustrated with different colors, as indicated. The isolate names in gray represent the VNTR-clustered strains that were separated by WGS. Comparison of cluster sizes in C-type, M-type, and N-type clusters in the Shanghai MDR-TB dataset (b) and the Global MDR-TB dataset (c); each dot represents a genomic cluster identified by WGS

