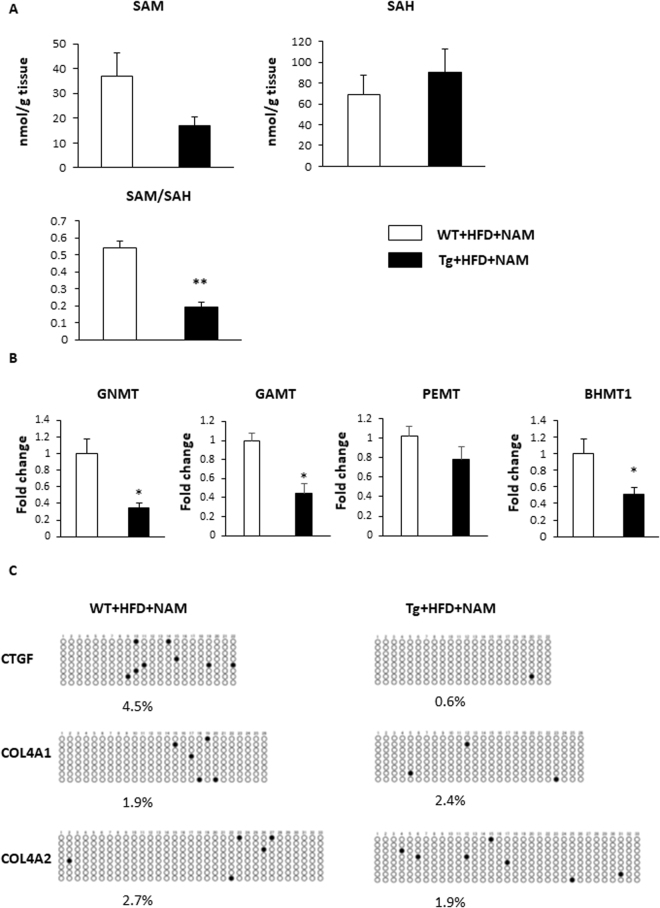
Figure 7.
NNMT overexpression reduces the liver SAM/SAH ratio and decreases the level of CTGF promoter methylation. (A) SAM levels, SAH levels, and SAM/SAH ratios in the livers of NMMT Tg mice (black bars) and WT littermates (white bars) on an HFD with NAM. The data represent the means ± SEM (n = 3 animals/group). (B) Relative GNMT, GAMT, PEMT and BHMT1 mRNA expression in the liver. (n = 3 per group). (C) Bisulfite sequencing of the CTGF, Col4a1 and Col4a2 CpG island. Each circle indicates a CpG site in the sequence, and each line of circles represents analysis of a single cloned allele. ○, unmethylated CpG sites; •, methylated CpG sites. Abbreviations: NNMT, nicotinamide N-methyltransferase; SAM, S-adenosylmethionine; SAH, S-adenosylhomocysteine; HFD, high fat diet; NAM, nicotinamide; Tg, transgenic; WT, wild type; GNMT, glycine N-methyltransferase; GAMT, guanidinoacetate N-methyltransferase; PEMT, phosphatidylethanolamine N-methyltransferase; BHMT, betaine homocysteine methyltransferase; MSP, methylation-specific polymerase chain reaction; CTGF, connective tissue growth factor; COL, collagen.

