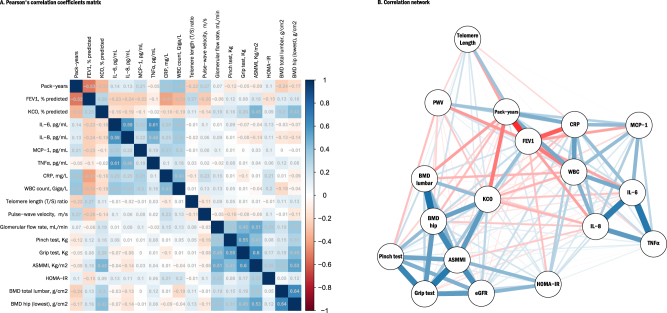
Figure 2.
Correlation between aging-related parameters. (A) Pearson’s correlation coefficients matrix and (B) Correlation network. (A) The matrix contains the Pearson’s correlation coefficients between smoking pack-years, pulmonary function parameters and the 15 aging-related parameters of interest. Colors indicate the direction and the strength of the correlation, with positive correlations being displayed as blue tones and negative ones as red tones. (B) The correlation network is constructed from all pairwise correlations between items in (A). Items are represented by nodes and are connected by edges. Red and blue lines represent negative and positive correlations, respectively. Line width color saturation is proportional to the strength of the correlation.

