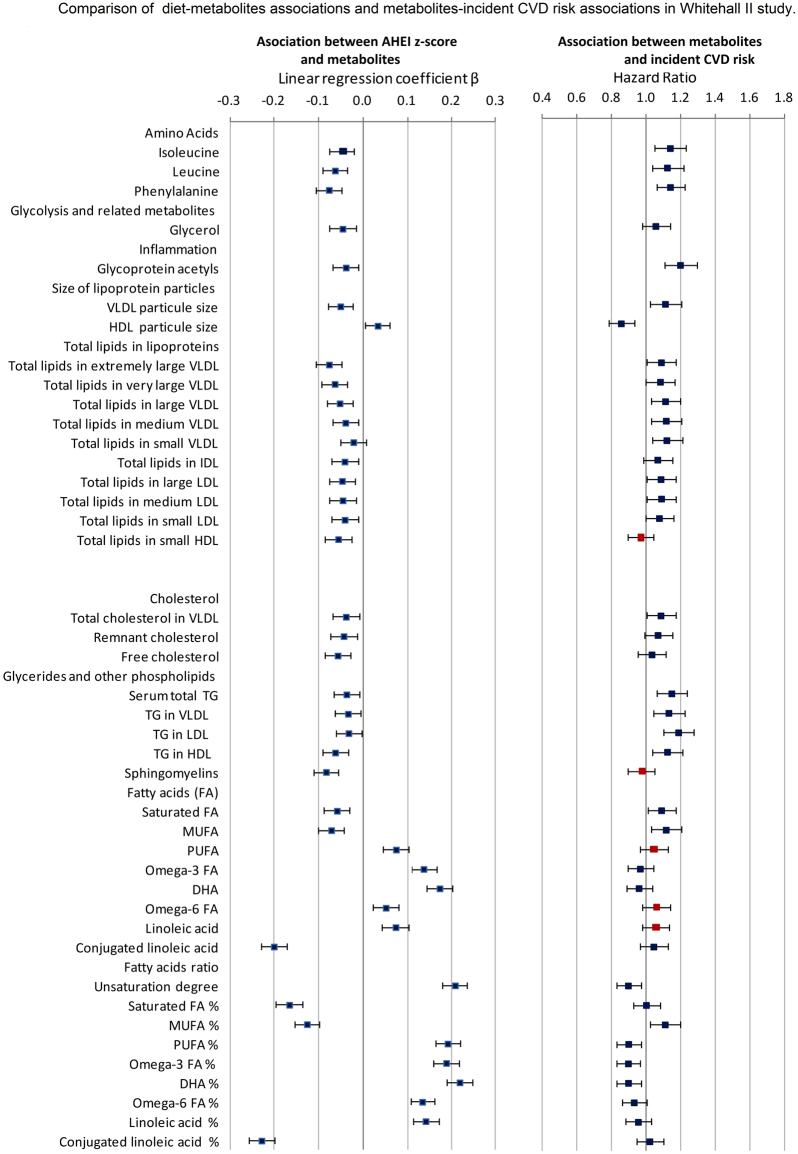
Figure 3.
Comparison of diet-metabolites associations and metabolites-incident CVD risk associations in Whitehall II study.  Associations directionally concordant.
  Associations directionally discordant. On the left hand size: Linear regression models estimating the associations between AHEI z-score and the 41 selected metabolites performed in 4824 participants and adjusted for age, sex, total energy intake, ethnicity, smoking habits, physical activity, type 2 diabetes, diastolic and systolic blood pressure, use of antihypertensive drugs and use of lipid-lowering drugs. Results are expressed as linear regression coefficients accompanied with their 95% confidence interval. To facilitate comparison, metabolites were first square root transformed and then standardized to z-scores (mean = 0, SD = 1). On the right hand size: Cox proportional hazards regression models estimating the association between the selected 41 metabolites and the risk of incident CVD over the 15.8 years of follow-up, performed in 5840 Whitehall II participant, adjusted for age, sex, total energy intake, ethnicity, smoking habits, physical activity, type 2 diabetes, diastolic and systolic blood pressure, use of antihypertensive medication. Results are expressed as Hazard Ratio accompanied with their 95% confidence interval. To facilitate comparison, metabolites were first square root transformed and then standardized to z-scores (mean = 0, SD = 1).

