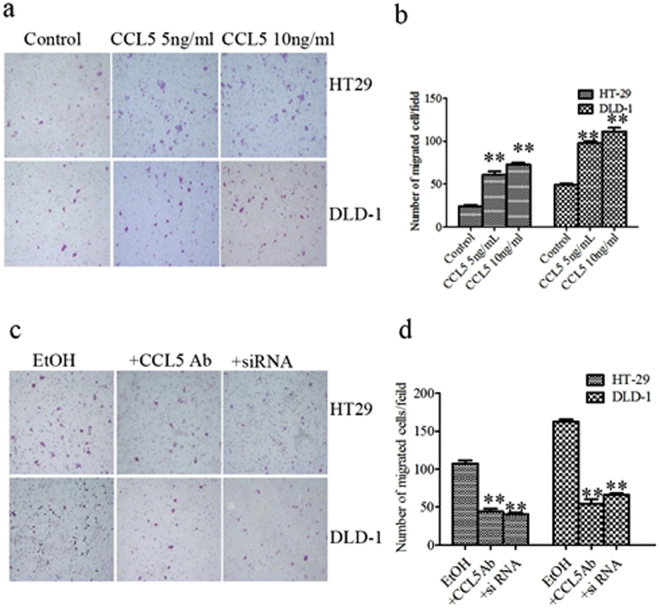
Figure 3.
CCL5 increases the migration of HT29 and DLD-1 cells. (a) HT29 and DLD-1cells were treated with CCL5 and then assayed for cell migration as described in methods and materials. Representative images of migration are shown. (b) Quantification of the migration of HT29 and DLD-1 cells. (c) HT29 and DLD-1 cells were exposed to alcohol or pretreated with CCL5 antibody as described in methods and materials. HT-29 and DLD-1 cells were induced by alcohol and transfected with siCCL5. After that, images of cells migrating through the chambers were assayed. (d) The cells migrated through the chamber were quantified. Each data point was the mean ± SEM of three independent experiments and presented relative to the controls. **P < 0.01.

