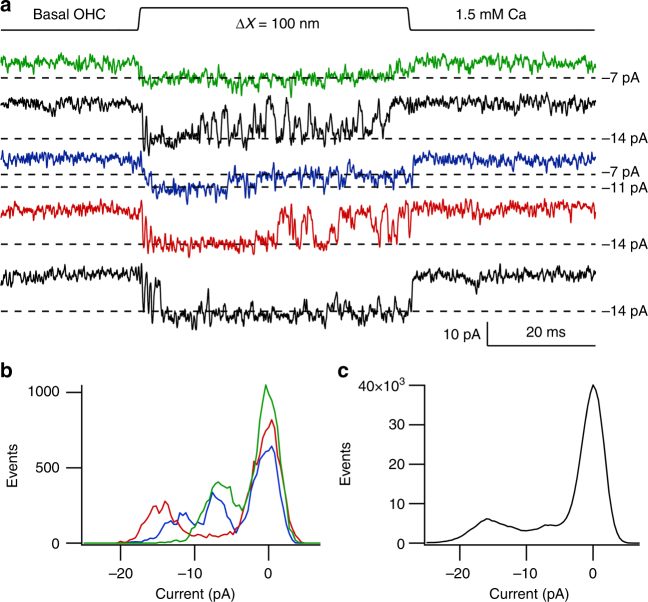
Fig. 3.
Multiple single-channel levels in a basal OHC. a Five exemplar traces showing channel events during 100 nm bundle deflection. The principal current levels are indicated by dashed lines corresponding to −7, −11, and −14 pA. b Amplitude histograms of the three colored traces showing the three levels of −7, −11 and −14 pA. c Amplitude histogram of all 41 traces from this recording. The levels are smeared so it is difficult to infer specific levels other than the largest one. Note the smearing was not always evident (Fig. 2b). OHC from P4 Tmc2−/− mouse; 1.5 mM external Ca2+; holding potential −84 mV

