Fig. 3.
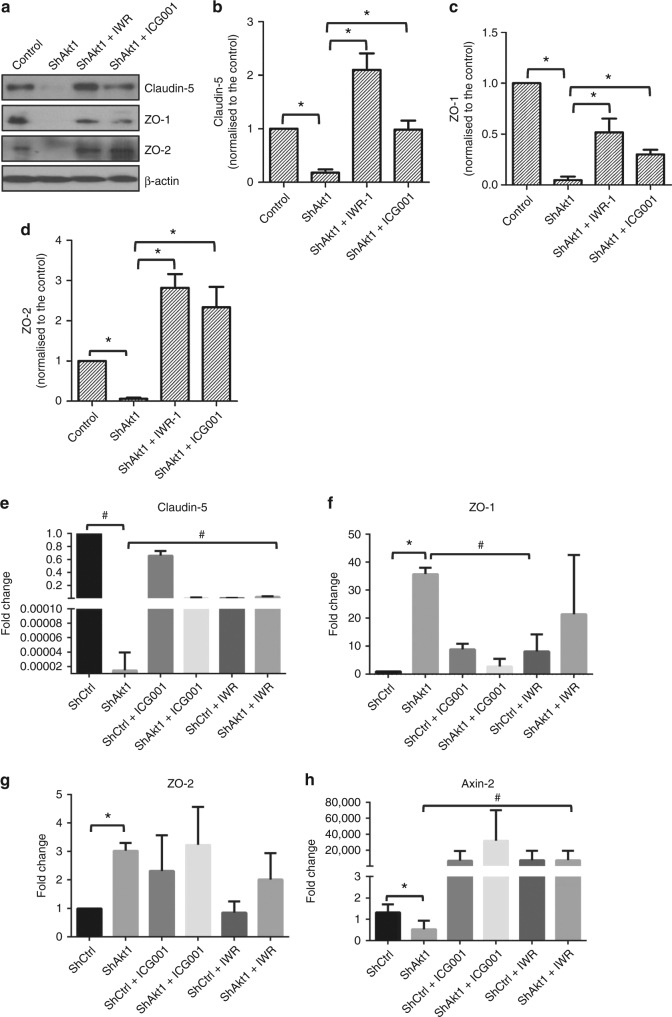
Pharmacological inhibition of β-catenin restores tight-junction protein expression in Akt1 knockout HLEC. a Representative western blot images showing expression levels of tight-junction proteins claudin-5, ZO-1 and ZO-2 compared to β-actin in shControl and shAkt1 HLEC lysates. b–d Bar graphs of western blot band densitometry showing changes in the expression levels of tight-junction proteins claudin-5, ZO-1 and ZO-2, respectively, and normalised to β-actin in shControl and shAkt1 HLEC lysates (n = 3). e–h Bar graphs of qRT-PCR analysed mRNA expression changes in tight-junction proteins claudin-5, ZO-1 and ZO-2, respectively, along with Axin-2, a positive control to confirm β-catenin transcriptional activity in shControl and shAkt1 HLECs (n = 6). Data are represented as mean ± SD. *p < 0.05; #p < 0.01

