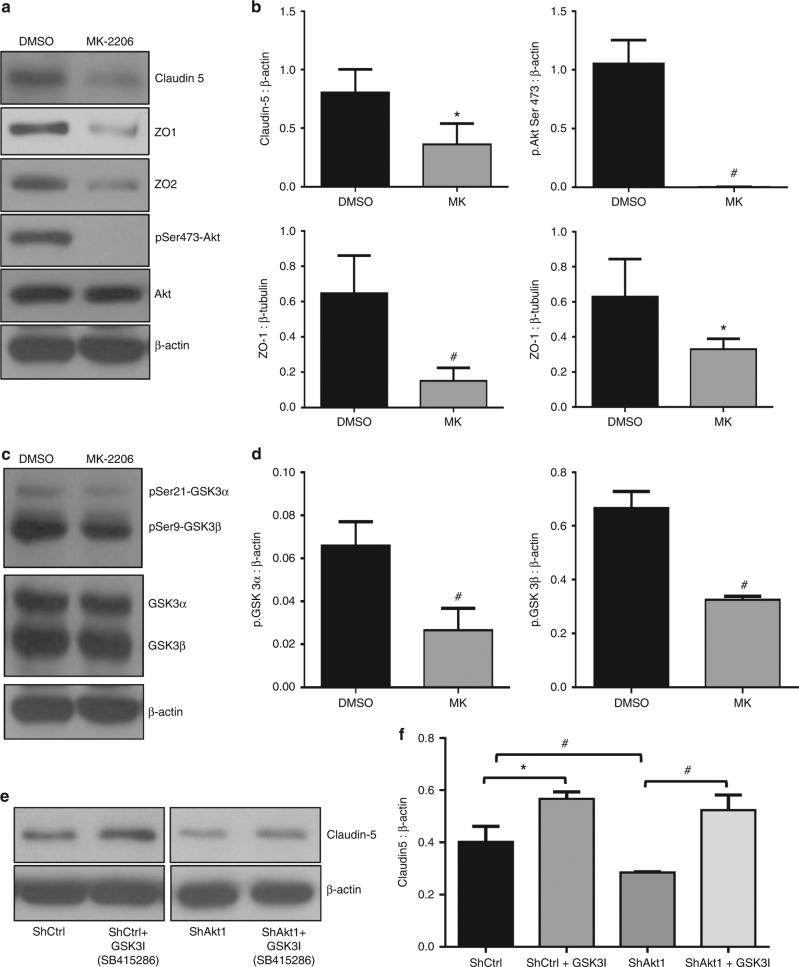
Fig. 5.
Pharmacological inhibition of Akt reduces the expression of tight-junction proteins claudin-5, ZO-1, ZO-2 in HLEC. a Representative western blot images showing expression levels of tight-junction proteins claudin-5, ZO-1 and ZO-2 compared to β-actin in shControl and shAkt1 HLEC lysates. b Bar graphs of western blot band densitometry showing changes in the expression levels of tight-junction proteins claudin-5, ZO-1 and ZO-2, and phosphorylated Akt, normalised to β-actin in shControl and shAkt1 HLEC lysates (n = 3). c Representative western blot images showing expression levels of phosphorylated GSK3α/β compared to total GSK3α/β and β-actin in shControl and shAkt1 HLEC lysates. d Bar graphs of western blot band densitometry showing changes in the decreased expression levels of phosphorylated GSK3α/β normalised to β-actin in shControl and shAkt1 HLEC lysates (n = 3). e Representative western blots showing increased expression levels of claudin-5 compared to β-actin in shControl and shAkt1 HLEC lysates in the presence and absence of GSK3 inhibitor SB415286. f Bar graphs of western blot band densitometry showing changes in the expression levels claudin-5 compared to β-actin in shControl and shAkt1 HLEC lysates in the presence and absence of GSK3 inhibitor SB415286. (n = 3). Data are represented as mean ± SD. *p < 0.05; #p < 0.01

