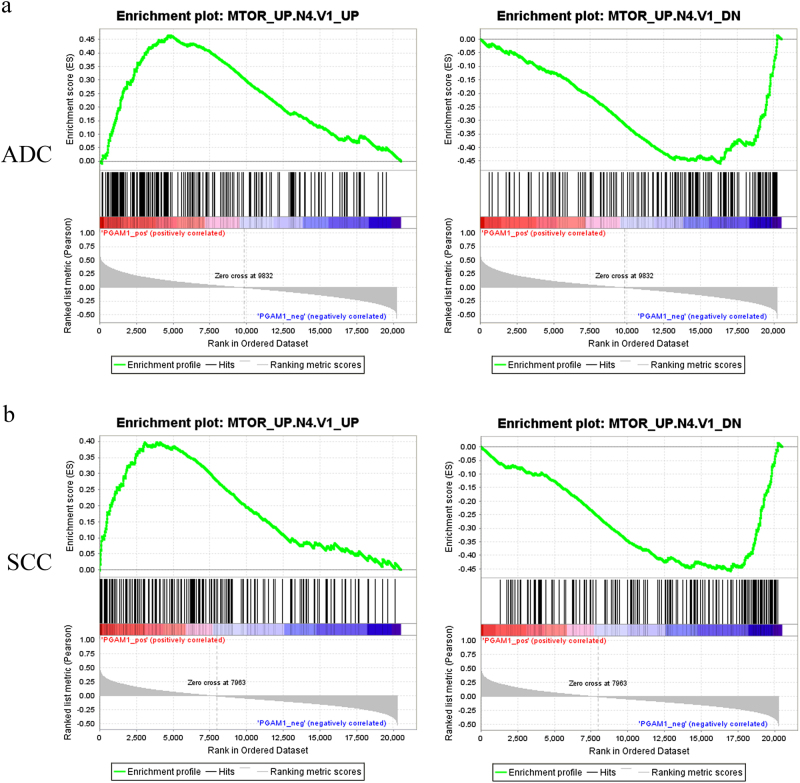
Fig. 5.
PGAM1 expression positively correlates with mTOR signaling pathway activity in human NSCLC. Based on PGAM1 expression levels, the gene set enrichment analyses were performed on NSCLC datasets from the TCGA database using the gene sets positively regulated by mTOR signaling (MTOR_UP.N4.V1_UP, the left panel) and the gene sets negatively regulated by mTOR signaling (MTOR_UP.N4.V1_DN, the right panel). a Analysis of 515 adenocarcinoma (ADC) patient samples. Left: Normalized Enrichment Score (NES) = 1.9564092, P < 0.01. Right: NES = −1.794588, P < 0.01. b Analysis of 501 squamous cell carcinoma (SCC) patient samples. Left: NES = 1.637388, P < 0.01. Right: NES = −1.8062531, P < 0.01. The barcode plot indicates the position of the genes in each gene set; red and blue colors represent positive and negative Pearson’s correlation with PGAM1 expression, respectively

