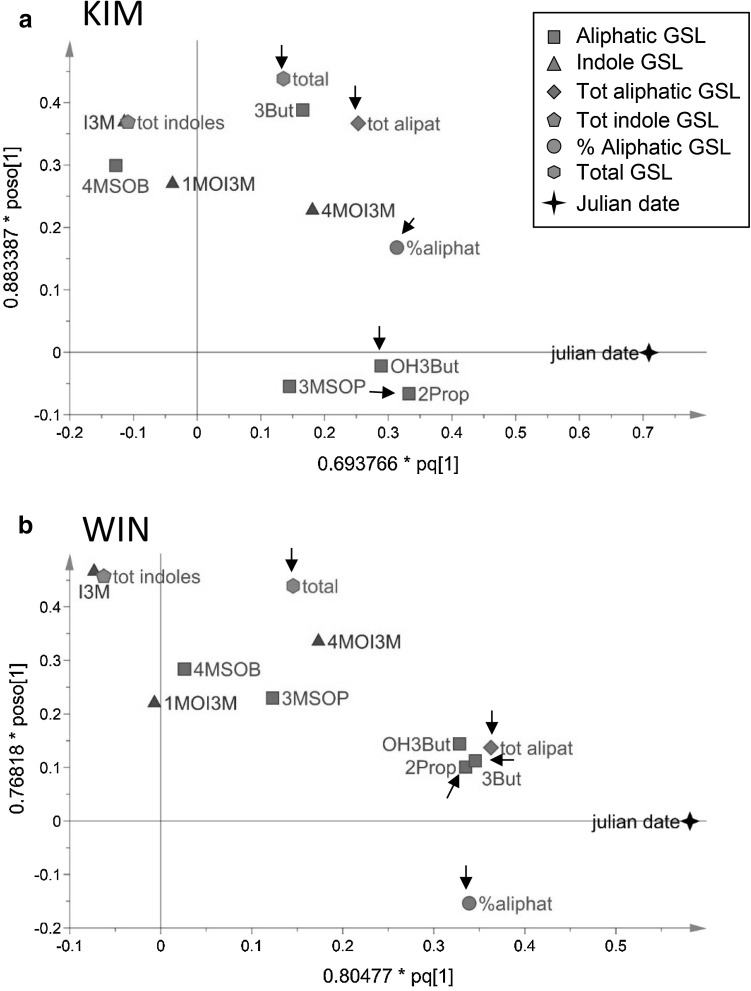
Fig. 5.
Multivariate analysis of within year glucosinolate dynamics in leaf tissues in plants originating from two wild cabbage populations, a KIM, b WIN in Dorset, England. GSL data presented in Fig. 4 were subjected to OPLS by means of partial least squares projections. The horizontal axis coincides with day of the year (Julian data) from left to right. The full names of aliphatic GSLs compounds are given in Fig. 1 and the “Glucosinolate analysis” section. tot aliphat totals of aliphatic GSLs, tot indole total of indole GSLs, total grand totals of GSLs, % aliphat percentage aliphatic of total. Arrows point at variables of which the correlation coefficient with time is significantly different from 0 and at the same time these variables contributed significantly to the separation of samples in relation to time based on model variable importance values (VIP). Variables with VIP > 1 are highly influential (Eriksson et al. 2006). Model statistics for KIM: overall significance statistical model F2,56 = 15.9, P < 0.001; OPLS predictive statistics, R2X = 0.417, R2Y = 0.398, Q2 = 0.362; for WIN: overall model significance, F2,56 = 12.2, P < 0.001; OPLS predictive statistics R2X = 0.353, R2Y = 0.364, Q2 = 0.303

