Figure 5.
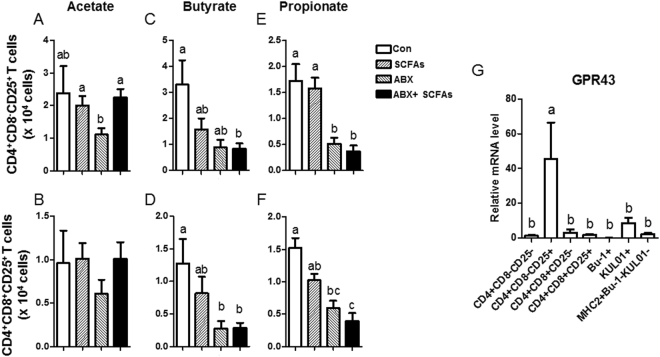
Changes in CD4+CD8−CD25+ and CD4+CD8+CD25+ T cells in chickens treated with acetate. SCFAs (acetate 50 mM, butyrate 30 mM, propionate 10 mM) and/or ABX in drinking water were administered to chickens at hatching for 7 days. The numbers of (A,C,E) CD4+CD8−CD25+ and (B,D,F) CD4+CD8+CD25+ T cells in cecal tonsils were calculated. (G) Subsets of CD4+ T cells, B cells (Bu-1+), and APCs (KUL01+, MHC class II (MHC2)+KUL01−Bu-1−) were sorted using an ARIA II FACS sorter. mRNA was extracted from each subset, and the expression level of GPR43 was determined by RT-qPCR. (A–G) Data were obtained from more than three chickens in each group and presented as the mean ± SD. Different characters indicate significant differences at P < 0.05. The figures are representative of three independent experiments.

