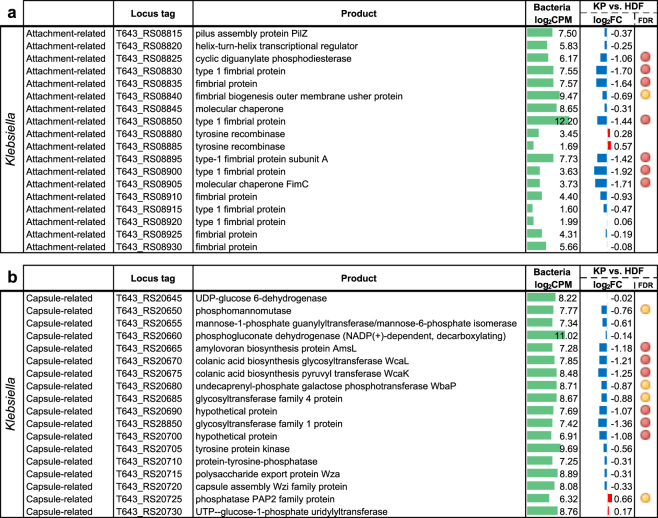
Figure 4.
Expression of K. pneumoniae (a) attachment-related and (b) capsule-related gene clusters in response to co-cultured HDF cells. Differentially regulated genes shown with edgeR false discovery rate (FDR): <0.05 (red circle) and <0.1 (yellow circle). Log2 fold change values of gene expression was shown as red (up-regulated) and blue (down-regulated) bar graphs with reference to monocultures. Bar scale from −4 to 4. Averaged gene expression level across control and treatment experiments (log2 read counts per million, log2CPM) was shown as green bar graphs. Bar scale from 0 to 15.

