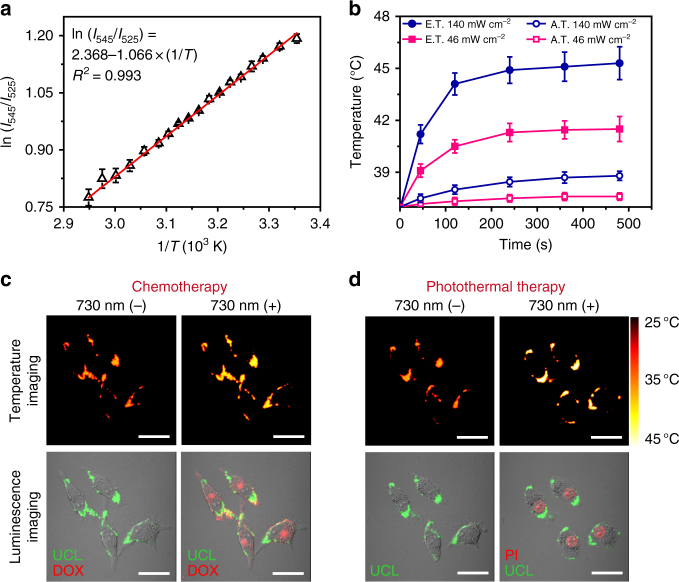
Fig. 5.
Eigen temperature sensing and drug release at cell level. a A plot of ln(I525/I545) versus 1/T to calibrate the thermometric scale for TR-UCNS in MIA PaCa-2 cells. Average values of I525/I545 under different temperatures were given to fit the calibration curve based on three repeated measurements of the UCL spectra. Error bars were defined as s.d. (n = 3). b Elevation of A.T. and E.T. of TR-UCNS-labeled cells under irradiation with a 730 nm laser at 140 and 46 mW cm−2. Average values of A.T. and E.T. under different time points were given based on three repeated measurements. Error bars were defined as s.d. (n = 3). c Temperature imaging and luminescence imaging (luminescence of TR-UCNS and DOX) of the TR-UCNS-labeled cells for photothermal-triggered chemotherapy with 730 nm laser irradiation (“730 (−)” and “730 (+)”, respectively, indicate the images taken before and after 730 nm laser irradiation. The power density of 730 nm laser used for drug release was 46 mW cm−2. Temperature mapping of MIA PaCa-2 cells were acquired according to the thermal equilibrium: (I545)/(I525) = C exp(−∆E/kT), where I545 and I525 were the UCL emission intensities in the wavelength region of 535–580 nm and 515–535 nm, respectively. Scale bars were defined as 30 µm. d Temperature imaging and luminescence imaging (luminescence of TR-UCNS and PI) of the TR-UCNS-labeled cells during photothermal therapy with 730 nm laser irradiation (“730 (−)” and “730 (+)”, respectively, indicate the images taken before and after 730 nm laser irradiation. The power density of 730 nm laser used for drug release was 140 mW cm−2. Scale bars were defined as 30 µm

