Fig. 7.
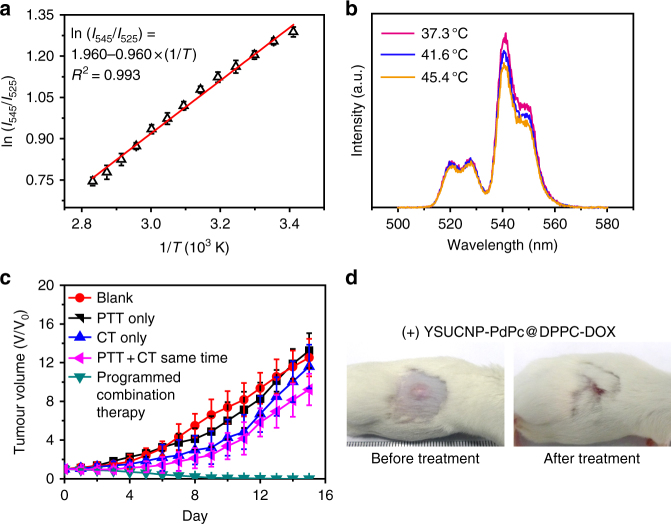
Eigen temperature sensing and programfmed combination therapy in vivo. a A plot of ln(I545/I525) versus 1/T to calibrate the thermometric scale for TR-UCNS in the tissue phantom. Each point was measured 3 times and the average values were used. Error bars were defined as s.d. (n = 3). b Upconversion luminescence spectra of TR-UCNS (500–580 nm) in tumor-bearing mice detected by fiber-optic spectrometer under different 730 nm laser power density at 0, 57, and 164 mW cm−2. Eigen temperature calculated by the upconversion luminescence spectra were 37.3, 41.6, and 45.4 °C. c Growth of tumors in different groups of mice (n = 5 in each group) after treatment. The relative tumor volumes were normalized to their initial sizes. Average values of the tumor volume of each group were based on the measurement of the tumors in five mice. Error bars were defined as s.d. (n = 5). d Representative photos of tumor-bearing mice with programmed combination therapy

