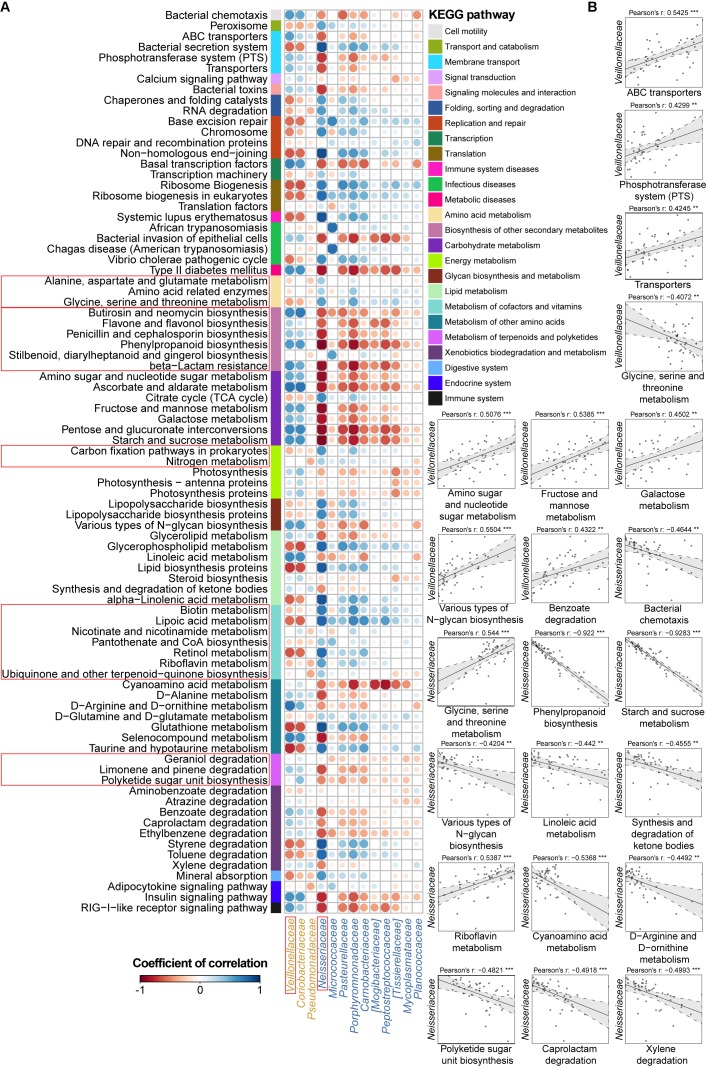
FIGURE 4.
Associations between altered families and functions in the CD microbial community with reference to HCs. (A) Pearson’s correlation array between the family and functional variables. Differentially abundant highest-detail pathways and families between the CD and HC groups were calculated using the Wilcoxon rank-sum test. The mid-detail pathways corresponding to differential functions are indicated by colored bars. The colors of the circles in the array represent the directions of the correlations, and their sizes correspond to the significance of the P-values (the larger circle represents the smaller P-value and thus, the higher significance). (B) Individual correlations of Veillonellaceae and Neisseriaceae with correlation coefficients ≥ 0.4 or ≤-0.4 and their P-values are shown (∗∗∗ indicates P < 0.001, ∗∗ indicates P < 0.01, and ∗ indicates P < 0.05).

