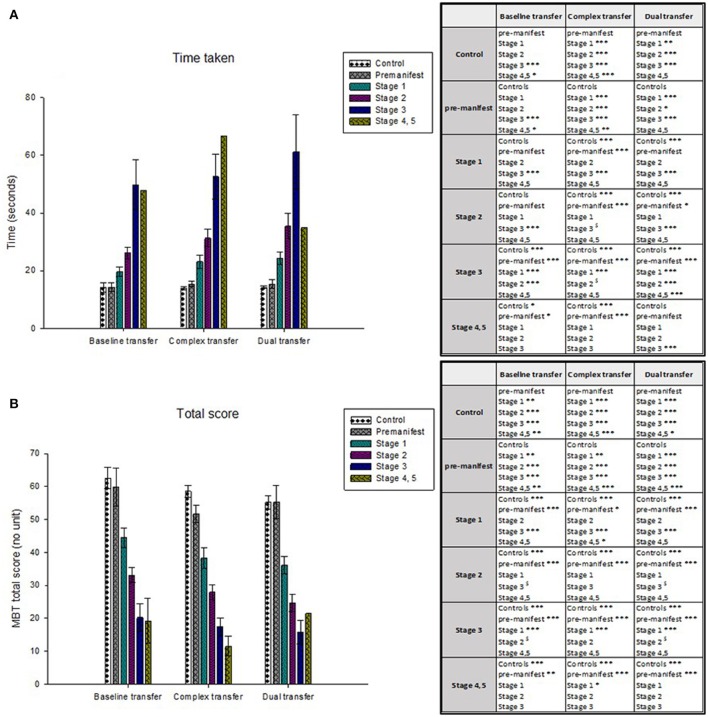
Figure 3.
The mean time taken is plotted in (A) and the mean MBT total scores are plotted in (B). Healthy controls and people in the early disease stages (stage 1) performed the transfer tasks significantly faster than those in the later disease stages (stage 4, 5). The same stepwise performance deterioration is evident according to the MBT total scores, from which healthy controls and people in the early disease stages achieved a greater MBT total score (indicative of a faster time and greater accuracy) compared to those in the more advanced disease stages. Significant differences between participant groups are presented in the tables, where *p < 0.05, **p < 0.01, ***p < 0.001.

