
Figure 2.
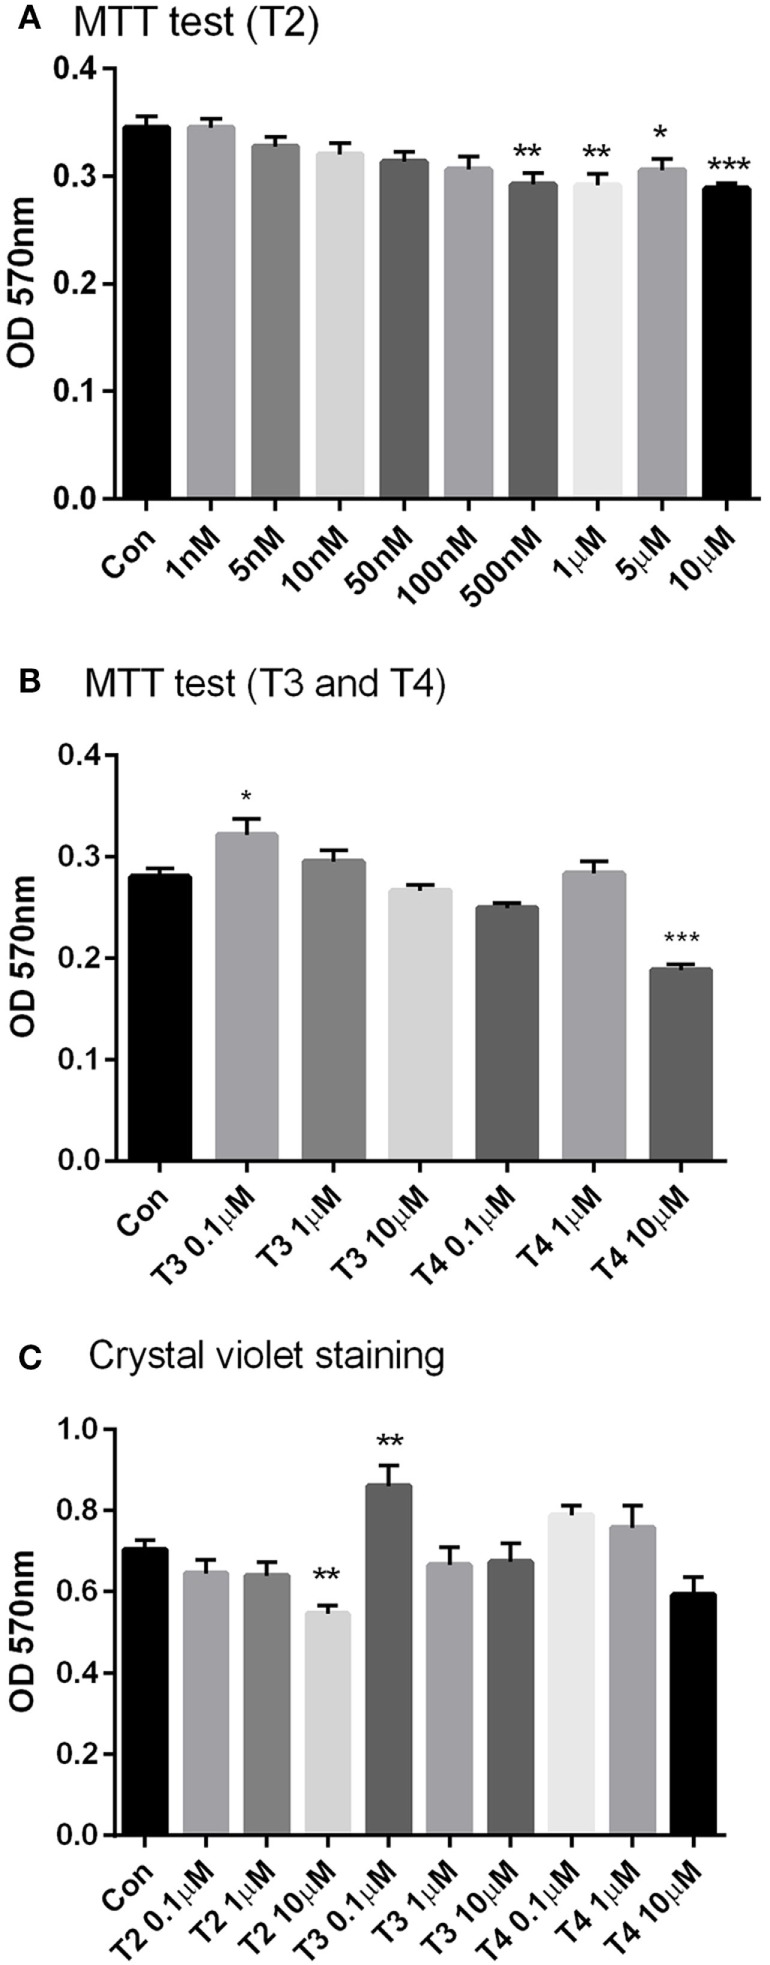
Cell viability. H9c2 cells were incubated for 24 h with a wide range of T2 (1 nM–10 μM), T3, and T4 (0.1–10 µM) concentrations in medium incubation and then the cell viability tests, MTT test (A,B), and crystal violet assay (C) were performed. All treatments received the same amount of vehicle. Control group was incubated with medium containing the same volume of vehicle. Data are plotted as means of 4–6 replicas ± SEM [one-way ANOVA, P < 0.0001, Dunnett’s post hoc test for multiple comparison, *P < 0.05, **P < 0.01, ***P < 0.001 vs control (con), n = 4–6 per group].