Figure 3.
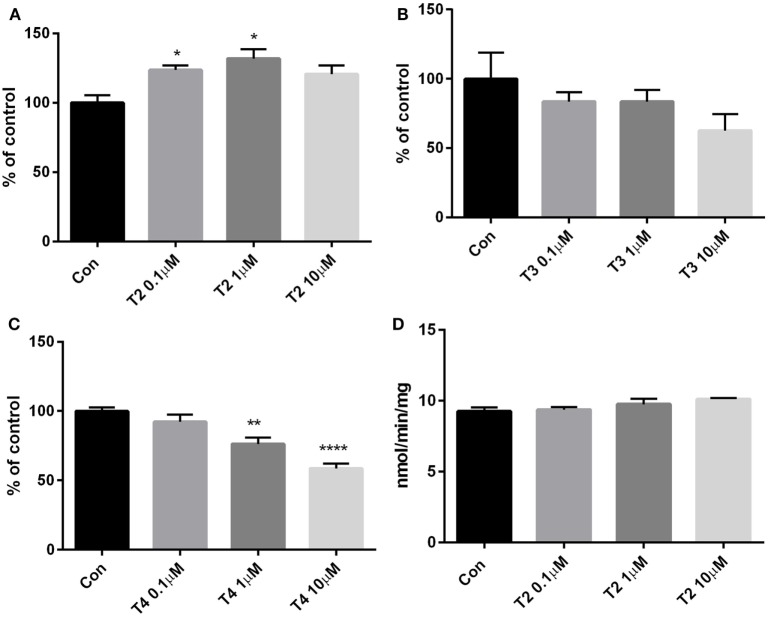
Glucose consumption and hexokinase activity. Glucose concentration was assayed in cell medium after 4 h treatment with (A) T2, (B) T3, or (C) T4 (0.1–10 µM). Results are the difference between the initial glucose concentration in medium (0.707 mg/ml, assessed with the glucose assay kit) and the final concentration, normalized to the total content of protein in lysate. Control cells were incubated with medium containing the same volume of vehicle. (D) Hexokinase activity assay was performed in cell lysates upon treatment with T2. Values are mean ± SEM of 3–4 replicates and are expressed as percent of control in the glucose consumption or as NADH nmol/min/mg in the enzyme activity. [one-way ANOVA, P < 0.05, Dunnett’s post hoc test for multiple comparison, *P < 0.05, **P < 0.01 vs control (con), n = 3–4 per groups].

