Figure 5.

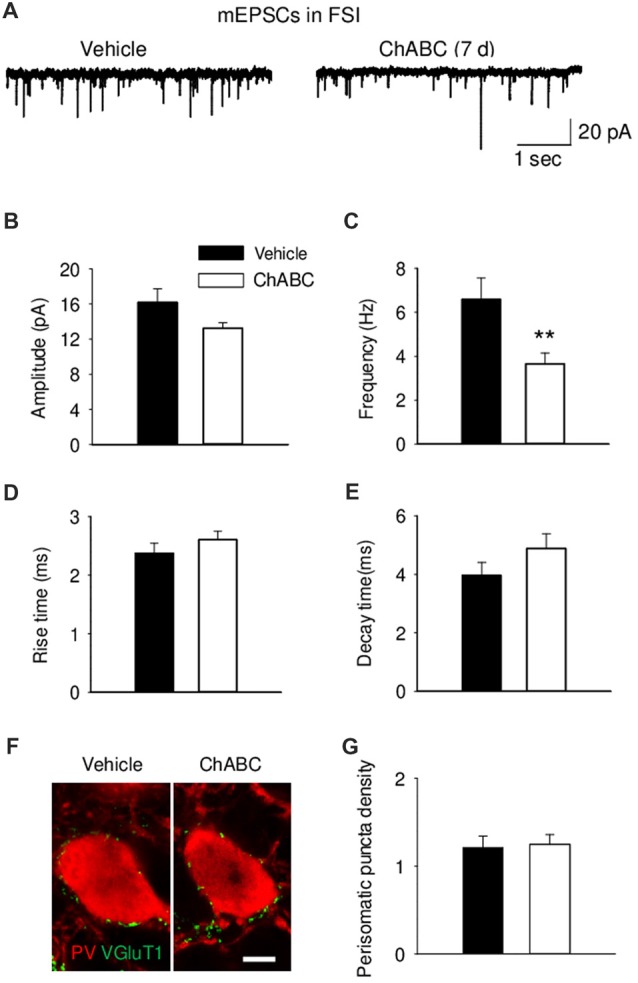
Decreased frequency of action-potential independent miniature EPSCs (mEPSCs) onto fast-spiking interneurons 7 days (7 d) after ChABC injection. Representative traces (A), amplitude (B), frequency (C), rise (D) and decay time (E) of mEPSCs in FSIs after Vehicle (n = 9) or ChABC (n = 9) treatments. (F) Graph representing VGluT1 expression in the perisomatic region of parvalbumin (PV)-expressing FSIs. Scale bar, 5 μm. (G) Perisomatic puncta density (number of puncta/10 μm of soma perimeter) after treatment with Vehicle (33 neurons from three mice) or ChABC (39 neurons from three mice). Bars represent mean ± SEM values (per animal) in vehicle- (black) and ChABC-treated (white) groups. **P < 0.01, t-test, compared with vehicle.
