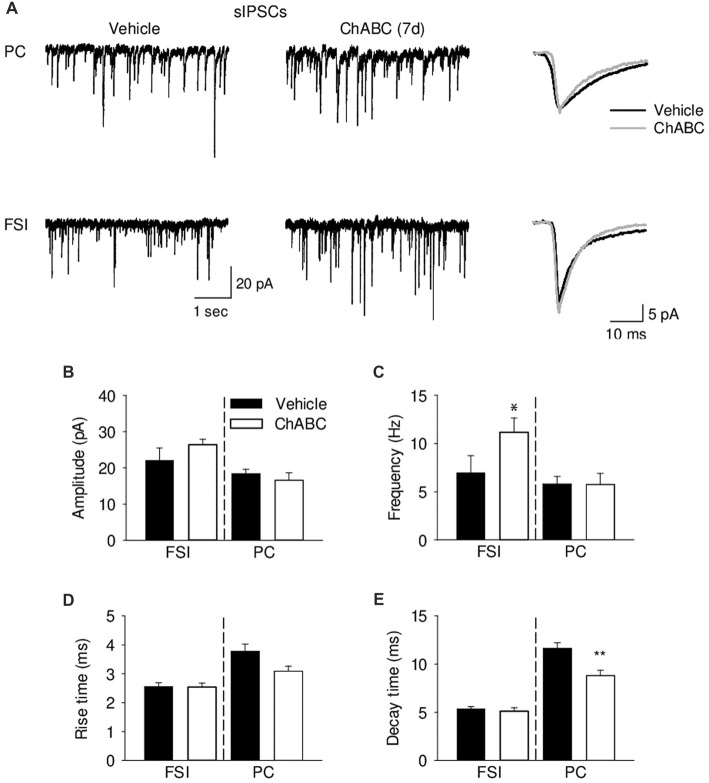
Figure 6.
Analysis of GABAergic transmission onto pyramidal neurons and fast-spiking interneurons 7 days (7 d) after ChABC injection. (A) Representative traces of sEPSC from CA2 pyramidal cells (upper) and FSIs (lower) in vehicle- and ChABC-injected hippocampal slices. Bar graphs of sIPSC amplitude (B), frequency (C), rise time (D) and decay time (E) of CA2 PCs and FSIs. Bars represent mean ± SEM in vehicle- (black) and ChABC-treated (white) FSIs (Vehicle, n = 9; ChABC, n = 14) and PCs (Vehicle, n = 14; ChABC, n = 10). *P < 0.05, t-test after log-transformation to normalize distributions; **P < 0.01, t-test, compared with vehicle.

