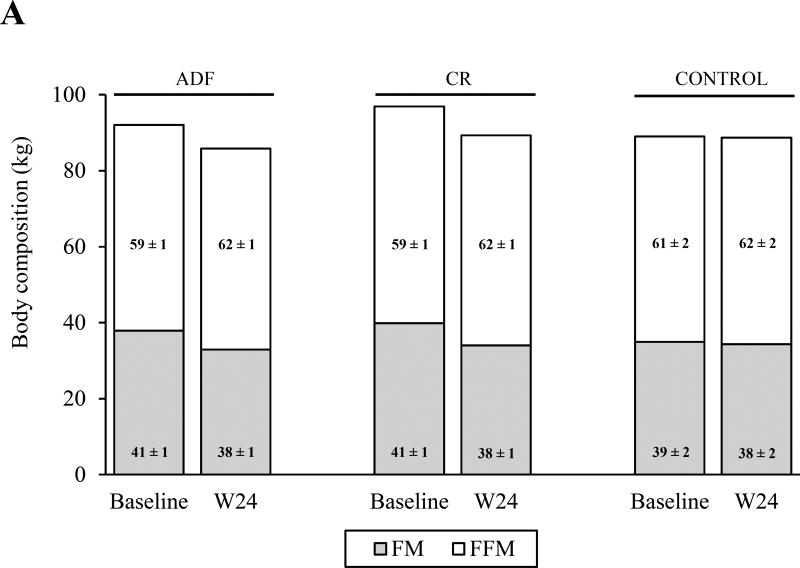
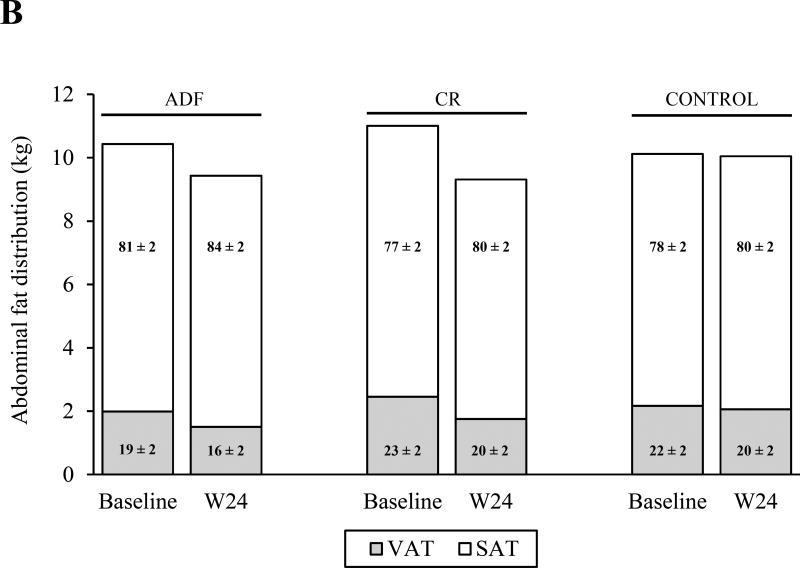
Figure 2.
Changes in body composition and abdominal fat distribution. The figure shows the change in body composition (measured by DEXA; A) and abdominal fat distribution (measured by MRI; B) from baseline to week 24 (W24). Absolute values are depicted on the y-axis; and percentage values are depicted within the columns, which represent the relative amounts of (A) fat mass (FM) and fat-free mass (FFM) to total mass, and the relative amounts of (B) visceral adipose tissue (VAT) and subcutaneous adipose tissue (SAT) to total abdominal mass. A, FM decreased in both intervention groups relative to the control group (P < 0.01 for all comparisons) with no differences between the intervention groups. FFM remained unchanged in all groups. The FFM:total mass ratio increased in both intervention groups compared to the control group (P < 0.01), with no differences between the intervention groups B, VAT decreased in both intervention groups relative to the control group (P < 0.05) with no difference between the intervention groups. SAT decreased in the calorie restriction (CR) group relative to the control group (P < 0.05) but did not change in the alternate day fasting (ADF) group relative to the other two groups. The VAT:SAT ratio did not change among the groups. Data are presented as mean ± SEM.


