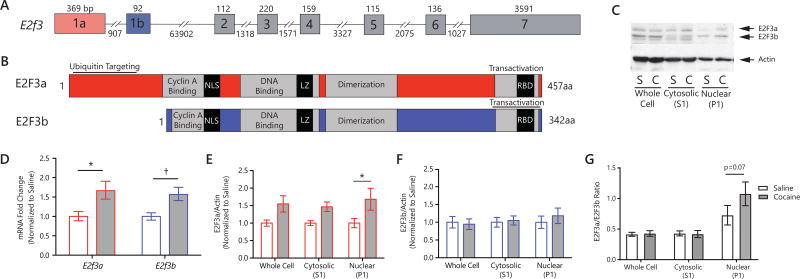
Figure 1. E2F3 regulation in NAc by cocaine.
(A) Structure of E2f3 gene detailing 8 exons, including exons 1a and 1b which are mutually exclusively spliced to form either E2f3a or E2f3b mRNA. (B) Structure of E2F3a and E2F3b proteins. Note that all domains are conserved in both isoforms except the ubiquitin-targeting domain at the N-terminus present in E2F3a only. (C) Western blot of E2F3a and E2F3b in whole cells, cytosolic (S1) and crude nuclear (P1) fractions. N=8–10 (D) qPCR quantification showing mRNA fold change in NAc normalized to saline (following ΔΔCt method using Gapdh as a control). Cocaine specifically increased E2f3a (main effect of treatment was F1,20=12.99, p=0.0018; post-hoc: p=0.0207) but not E2f3b mRNA. N=6 (E–G) Quantification of protein levels in NAc by Western blot for E2F3a/b in whole cell, cytosolic, and crude nuclear fractions, showing (E) E2F3a levels in NAc (main effect of drug: F1,37=16.59, p=0.0002; post-hoc, crude nuclear: p=0.0165); (F) E2F3b levels (no main effect of drug: F1,36=0.01, p=0.9113); (G) E2F3a/E2F3b ratio (main effect of cell compartment: F2,40=11.24, p=0.0001, post-hoc, crude nuclear: p=0.0955) Graphs show mean ± SEM. *p<0.05; †: not significant, p<0.1 (See also Figures S1 and S2)

