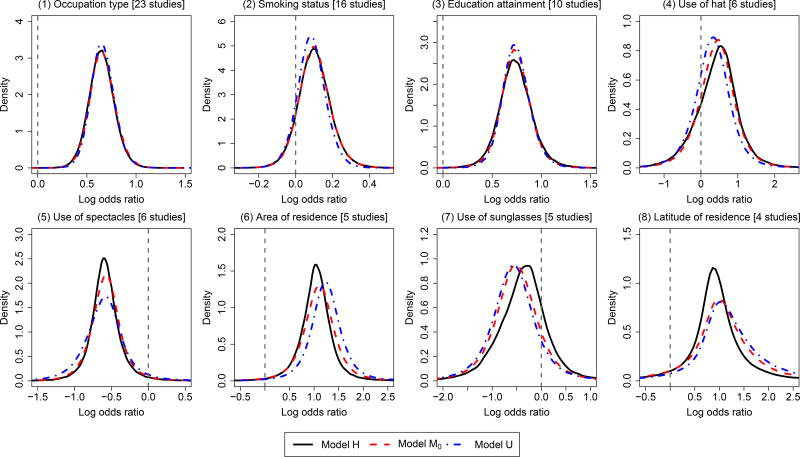
Figure 2.
Posterior density plots produced by Model H (accounting for both between- and within-study correlations), Model M0 (only accounting for between-study correlations), and Model U (univariate model ignoring both between- and within-study correlations) for the overall log odds ratios of the 8 risk factors in the pterygium data.

